.png&w=384&q=75)
1. Introduction
Fundamental research on wireless communications took place more than 100 years ago. Subsequently, the first commercial mobile system was installed in 1960's by Bell Labs and further research led to the development of analog cellular mobile communication system in 1980's to increase number of users in the system. Cellular system enables the reuse of Spectral resources in non-adjacent cell zones. More recently, digital cellular systems are introduced in 1990's to transmit digital data consisting of not only voice but also data and images at faster data rates apart from conventional voice communication, a number of new applications like sensor networks, mesh networks and others have used a variety of communication standards for data transfer.
Code Division Multiple Access (CDMA) is a channel access method utilized by various radio communication technologies. It should not be confused with the mobile phone standards called CDMA and CDMA2000 (which are often referred to as simply "CDMA"), that use CDMA as their underlying channel access methods [1]. CDMA is a nonconventional multiple-access technique that immediately found wide application in modern wireless systems. In CDMA, the entire bandwidth is made available simultaneously to all signals. Theoretically, very little dynamic coordination is required, as opposed to FDMA [Frequency division multiple access] and TDMA [Time division multiple access]in which frequency and time management have a direct impact on their performances. To accomplish CDMA systems, spread-spectrum techniques are used [2].
Theoretical performance of wireless communication systems has been evaluated using computer simulations without the need for actual prototype development. The field of testing digital wireless communication has been categorized into three types: point-to point, point-to-multipoint and multipoint-to-multipoint communication. Point-to-point communication corresponds to information sharing between one transmitter and one receiver, point-to-multipoint corresponds to one transmitter communicating with several receivers, and multipoint-to-multipoint means several transmitters are capable of sending information to many receivers at any time. In this paper, the point-to-point communication system has been considered.
Point-to-point communication concept is shown in figure 1. Even though, the input data from a user is usually generated in continuous time domain; it is advantageous to transmit discrete information over the digital communication channel. Accordingly, the input data is first digitized and compressed in the source encoder. In addition, several input data bits can be combined together and transmitted in the form of a symbol to increase data rate. The compressed data is then fed to the channel encoder which adds appropriate redundant bits to the data that helps in the reduction of transmission errors at the receiver. Different error correction codes such as convolution codes, codes or Reed-Solomon codes are widely used in practical systems.
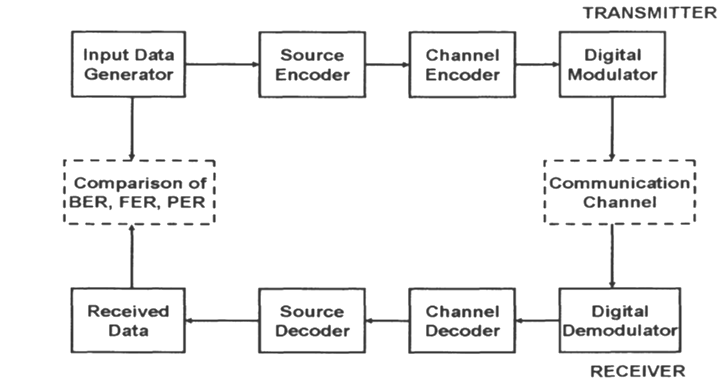
Fig. 1. Typical point-to-point communication system block diagram
Channel encoded data is then fed into a digital modulator which modulates the carrier signal and finally transmitted over the communication channel. Carrier signal can be mathematically represented as: s(t)=A(t)cos(2πfct+θ(t)).
Where Α (t), f_c, θ(t) are amplitude, frequency and phase of carrier signal respectively. Based on the input data signal, digital modulator changes one of these characteristics of the carrier signal to achieve required modulation. In this paper, change of phase characteristics of the transmitted signal, so called phase modulation is only considered. At the receiver, baseband signal is detected in the digital demodulator. Then, detected bits are fed into the channel decoder, where error correction logic is applied to recover the channel compensated data bits. Finally, the data is fed to source decoder in order to retrieve transmitted data bits.
Multiple access of the communication channel for different users is accomplished by allotting different time slots (TDMA), different transmission frequencies and sub channels (FDMA) or different orthogonal spreading codes (CDMA) for modulation. The Channel performance is measured in terms of either bit error rate (BER), frame error rate (FER) or packet error rate (PER) based on the data structure used for the transmission. Performance of the channel is affected by receiver noise level, level of the received signal (in turn depends on the transmitted signal), fading environment and level of interference signals, including multiuser and multipath kinds.
In this paper, CDMA multiple access system has been studied and simulated for its BER performance under AWG noise, Rayleigh fading channel conditions and multiuser interference. Furthermore, simulation studies have been performed at baseband level without RF band modulation / demodulation as a lot of sampling data is required to represent signals at RF band.
In a wideband CDMA system, where the channel bandwidth (1.25 to 5 MHz) is usually much higher than the coherence bandwidth of most urban areas (about 100 to 200 kHz), each of the reflected waves that have any significant energy, with delays that are multiples of the chip periods (that is, 0.2713 to 0.8138ms) [3, 4].
One mobile communications access scheme, which found popularity in the 1990s, is the spread spectrum–based CDMA technique. As mentioned above, in CDMA, all users transmit in the same frequency band and access the transmission medium at the same time. Every user’s signal is modulated by a unique deterministic code sequence, a duplicate of which can be generated at the receiver. By correlating the received signal with the same sequence, the desired signal can be demodulated. Then, all unwanted signals will not be demodulated and will remain effectively as noise [5].
Interference Analysis and Reduction for Wireless Systems
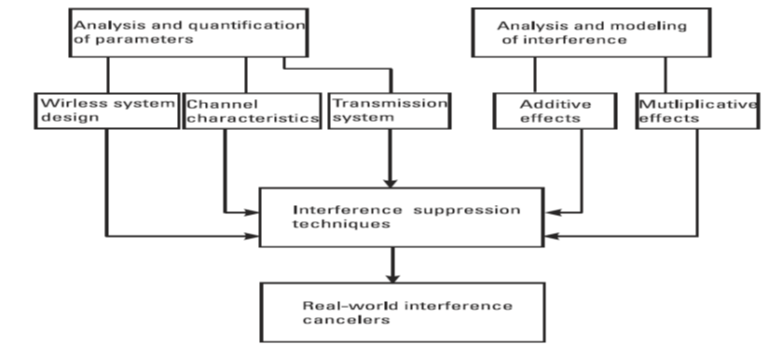
Fig. 2. Methodology of interference analysis and suppression [16]
Spread spectrum systems transmit the information signal after spectrum spreading to a bandwidth N times larger, where N is called processing gain.
It is given by:
N=B_s/B`2q.
Where B_sthe bandwidth of the spread spectrum signal and B is the bandwidth of the original information signal. In conjunction with CDMA, this technique of spreading the information spectrum is the key to improving its detection in an interference environment. It also allows narrowband signals exhibiting a significantly higher spectral density to share the same frequency band [6].
Basic building blocks of any MultiMate signal processing systems are decimators and interpolators and MultiMate systems result in efficient processing of signals as sampling rates of the signals at various internal points of the system are kept at optimal value according to the NY [full name] Quist theorem. MultiMate systems found applications in various fields such as communications, speech processing and spectral analysis. Review of MultiMate filter banks, polyphone networks and their applications to audio signal processing are presented in [3].
It was shown that Walsh codes have the lowest total sum of square of cross-correlation values as mentioned. Variants of Gold and Walsh codes that can be used for spread spectrum applications are generated. Similarly, references describe the methods for increasing capacity of the system in synchronous communication without considering their asynchronous performance.
Go lay complementary sequences and zero correlation sequences are defined in the context of minimizing total periodic auto- and cross-correlation values and peak to mean power ratios in the case of quasi-synchronous multiuser transmission. These sets of spreading codes give good performance in the quasi-synchronous zone, but the availability of number of codes for multiuser communication is limited.
This paper presents the design methodology for generating different types of new spread spectrum code sets that can be used in CDMA systems for both synchronous and asynchronous communication. A few examples of such designed code sets and performance comparisons have been made with presently used CDMA codes under various channel conditions.
Basic digital signal processing concepts, terminologies and Multi rate signal processing techniques have been introduced. Conditions required for perfect reconstruction of the signal are discussed in the context of a two-band perfect reconstruction quadrature mirror filter (PR-QMF) bank. Later, PR-QMF [full name] bank concepts are extended for the design of an M-band filter bank. Multi rate orthogonal Tran’s multiplexer architecture is in turn derived from M-band orthogonal filter bank which acts as a fundamental tool to implement any digital communication systems [3].
The maximum number of simultaneous users satisfying Qu’s requirements, a typical capacity definition in CDMA systems, should be evaluated in both single cell and multiple cell environments, as system capacity is a basic problem to research resource management and CAC. In this chapter, we tackle this issue in a CDMA system supporting multiclass services such that a simple upper-bounded hyper plane concept is formulated to visualize the capacity of a multimedia CDMA system. The tradeoffs between the level of system resources needed for a certain user and that needed for others are illustrated analytically within the concept of resource management.
In CDMA systems, all users are equally allotted to all available time and frequency slots, with the aim of optimizing the overall throughput by maximizing the number of users in the system. In CDMA systems, user spreading codes (filters) cannot be unit sample functions as in TDMA or frequency selective as in FDMA. Instead, filters or orthogonal spreading codes are designed such that they are simultaneously spread in both the time and the frequency domains with minimum inter- and intra-code correlations.
Transform (DTFT) pair satisfying the relations [3].
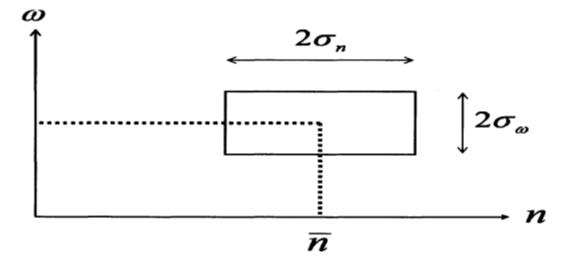
Fig. 3. Time-frequency tile of a discrete-time function
2. Mathematical Model for CDMA Communications
The received signal in a synchronized Kiser CDMA system embedded in additive white Gaussian (AWGN) noise can be modeled as reciever. Where τ k are the relative time delays between different user codes received at the receiver.
Bit durations, associated relative delays and cross-correlations between the two users (k, i) are shown in Figure 4.1 for the examples of two intervals i= 0 and i=1. User k is switched on after user i with a delay of τ. It might be noted that for synchronous users, τ, = τ 2 = ...τ «= 0, implying that all code sequences start at the same instant. Therefore, orthogonally of spreading codes redeems all ΜΑI. In asynchronous CDMA, two cross-correlation values Ρk» Pk, 'between a pair of.
Code sequences; depend on the timing offset between them. If k > 1, cross correlation values are defined as [3, 7].
2.1. M-sequences:
- M-sequence (binary maximal length shift-register sequence).
- Generated using linear feedback shift-register and exclusive OR-gate circuits.
- Linear generator polynomial g(x) of degree m>0.
- Output of the shift-register circuit is transformed to 1 if it is 0, and -1 if it is 1.
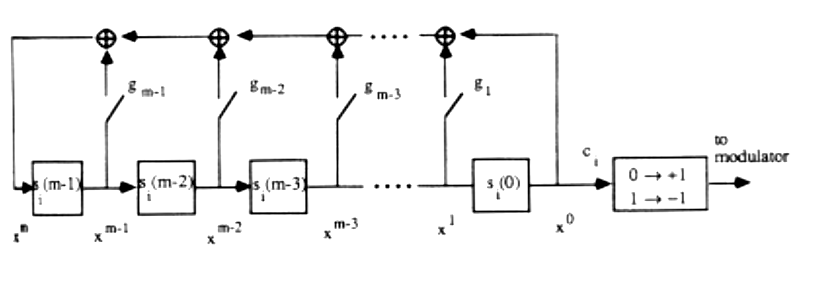
Fig. 4. Output of the shift-register circuit
If a window of width m is slid along an m-sequence in ![]() , each of
, each of ![]() -1 nonzero binary m-tuples is seen exactly once.
-1 nonzero binary m-tuples is seen exactly once.
- Property IV – One more 1 than 0’s.
Any m-sequence in ![]() contains
contains ![]() 1’s and
1’s and ![]() 1 0’s.
1 0’s.
- Property V – The addition Property.
The sum of two m-sequence in ![]() w3w1 (mod 2, term by term) is another in
w3w1 (mod 2, term by term) is another in ![]() .
.
The sum of an m-sequence and a cyclic shift of itself (mod 2, term by term) is another m-sequence.
The normalized periodic autocorrelation function of an m-sequence, defined ![]() .
.
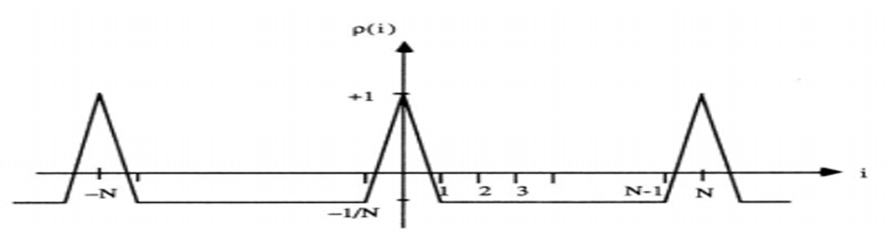
Fig. 5. The normalized periodic autocorrelation function of an m-sequence- proved easily by shift and add property
A run is string of consecutive 1’s or a string of consecutive 0’s.
In any m-sequence, one-half of the runs have length 1, one quarter.
Have length 2, one-eighth have length 3, and so on. In Particular, there is one run of length m of 1’s, one run of length m-1 of 0’s.
There is exactly one m-sequence c~ in the set Sm that satisfies (▁C) ̃= (▁C) ̃_2i.
The m-sequence (▁C) ̃ is called the characteristic m-sequence.
Or characteristic phase of the m-sequence in Sm.
The decimation by n>0 of a m-sequence c, denoted as c [n], has a period equal to N/gcd (N, n), if it is not the all-zero Sequence, its generator polynomial gˆ (x) has roots that are nth powers of the roots of.
- Autocorrelation function for both m-sequences: thumb-tack shaped.
- t(m)=1+2^⌊(m+2)/2⌋ =5.
- Cross correlation function is three – valued: -1, -5, or 3.
2.2. Walsh codes
Walsh codes are generated by mapping rows of special square matrices called Hadamard matrices [8, p. 48-54]. Walsh matrices are obtained from Hadamard matrices with the mapping of the elements {0, 1} onto {1, –1}, respectively. These matrices contain one row of all zeros and other rows of equal number of zeros and ones. They are recursively generated from using the following identities [9].
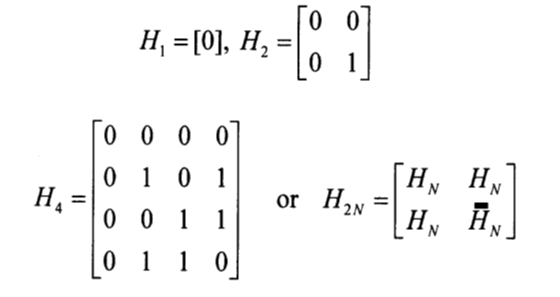
Fig. 6
Walsh matrices of higher dimensions can also be obtained by taking Kronecke Matrix product of Walsh matrices with lower lengths. Walsh functions thus generated have a size of N = ![]() , where n is of any integer.
, where n is of any integer.
2.3. Kasami Codes
Procedure for generating Kasami codes is similar to that of Gold code generation. Small Kasami set of ![]() sequences and length
sequences and length ![]() –1 (n is even) is obtained by decimating the first m-sequence with to get second m-sequence and then taking modulo-two addition of both m-sequences. Small Kasami set have three correlation values that match with Welch correlation bound values.
–1 (n is even) is obtained by decimating the first m-sequence with to get second m-sequence and then taking modulo-two addition of both m-sequences. Small Kasami set have three correlation values that match with Welch correlation bound values.
- The cross correlation function for two Kasami sequences takes on values in the set.
- The total number of sequences in the set is
 .
. - Consists of sequences of period
 -1, and contains both the Gold sequences and the small set of Kasami sequences as subsets.
 - Let m-sequences y and z formed by the decimation of
 by
by  +1 an
+1 an  +1, and take all sequences formed by adding
  ,
,  and z with different shifts of
  and
and  .
. - The number of Kasami sequences
 .
.
2.4. Barker codes
The Barker code is a sequence of n values (code-symbols) of +1 and −1. Barker code has good auto-correlation properties and with some pairs, the low cross-correlation so that they can be used in multi-user environment. The Barker code gives code with different lengths and similar autocorrelation properties as the m-sequence.
3. Generation of the evaluation of M-sequence functions and automated correlation
3.1. Signal Generator code Barker
Figure 6: Block of the Barker code chart with N = 7:
- (Product) Multiplication of Signals.
- (Constant) Constant.
- (Add) Summation of signals.
- (Scope) Oscilloscope.
Table
Barker code
Code length | Barker Code |
1 | [-1] |
2 | [-1 1]; |
3 | [-1 -1 1] |
4 | [-1 -1 1 -1] |
5 | [-1 -1 -1 1 -1] |
7 | [-1 -1 -1 1 1 -1 1] |
11 | [-1 -1 -1 1 1 1 -1 1 1 -1 1] |
13 | [-1 -1 -1 -1 -1 1 1 -1 -1 1 -1 1 -1] |
3.2. Signal Barker code block without considering the amplifier N=13
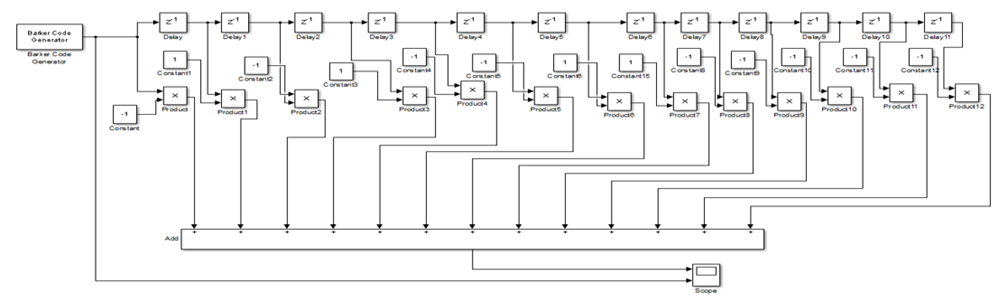
Fig. 7. Barker code block diagram results without considering the amplifier N=13
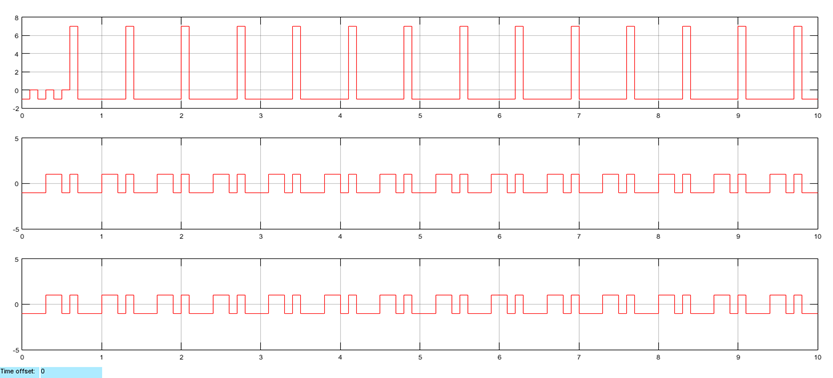
Fig. 8. The results of the block diagram of the Barker code of the amplifier signal at N =7
- The result of the simulation at the output of the generator from the output of the amplifier at N =7.
- Signal generator at the input after mortise (post-cleanser).
- signal of the generator input before the amplifier.
3.3. M-sequence signal amplifier and white noise (AWGN)
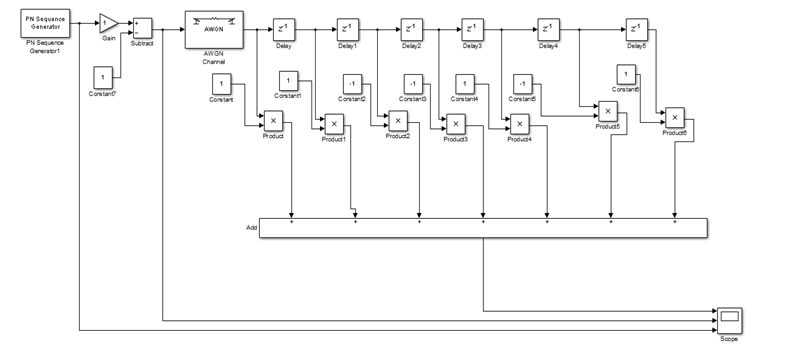
Fig. 9. Block diagram of M-sequence generator with white noise amplifier (AWGN) N = N = 7
- (Delay) Delayed signal.
- (Product).
- (Constant).
- (Add) Summation of signals.
- (Scope) Oscilloscope.
- White noise (AWGN).
SNR=10.
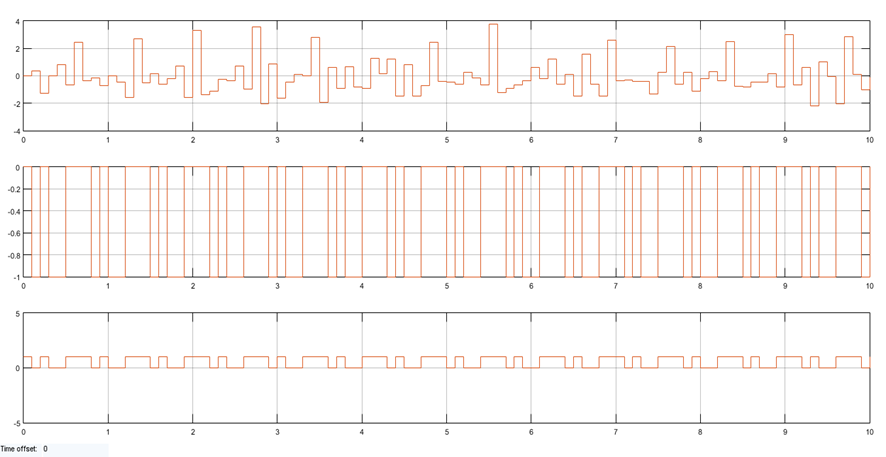
Fig. 10. The results of the signal amplifier sequence and white noise (AWGN) SNR = 10, N = 7
- Signal Generator on the Signal Analyzer Input.
- Results modeling on the generator output of the block diagram of the code M-sequences with a signal amplifier on the effect of white noise = [10] N = 7.
- The signal generator at the input in front of the signal amplifier.
3.4. M-sequences of the signal amplifier and white noise (AWGN) N = 31
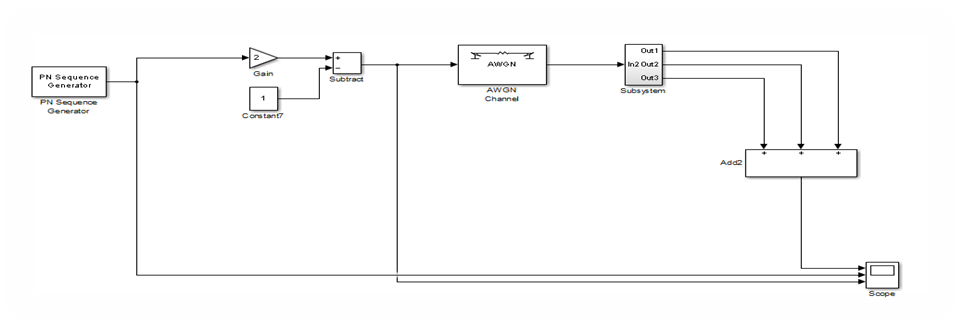
Fig. 11. Block diagram of the M-sequences of the signal amplifier and white noise (AWGN) N = 31
- (Delay) Delayed signal.
- (Product) Multiplication of Signals.
- (Constant) constant.
- (Add) smmation of signals.
- (Scope) Oscilloscope.
- Block of white noise (AWGN).
- (Subsystem).
Case: SNR= 0.
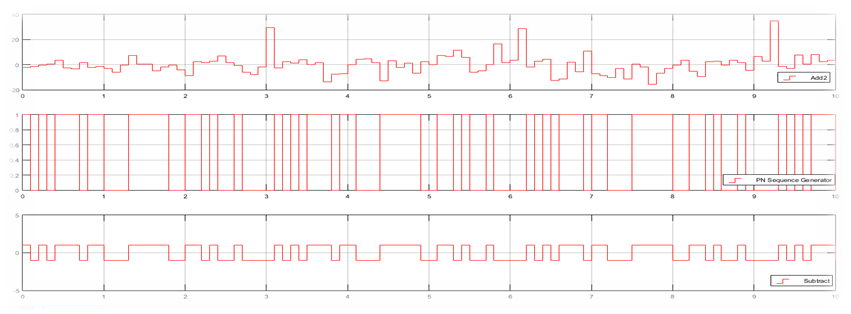
Fig. 12. The results of the signal amplifier sequence and white noise (AWGN) SNR = 0, N = 31
- Results simulation of the output of the generator of the block diagram of the M-sequence code with the account of the signal amplifier on the effect of white noise = [10] N = 31.
- The signal generator at the input after the signal amplifier.
- The signal generator at the input in front of the signal amplified.
4. Probabilities of M-sequences ... N = 31
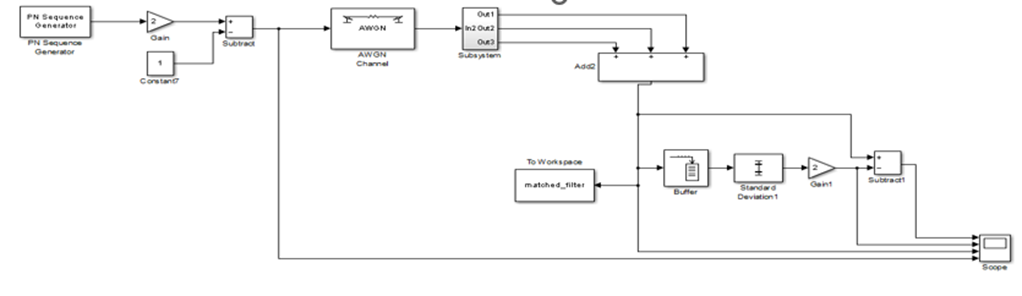
Fig. 13. Block diagrams Probabilities of M-sequences ... N = 31
Variable name [Matched filter]:
- Chances of Threshold.
- Threshold = 20.
- Threshold =15.
- Threshold = 1.
Case: SNR = 0.
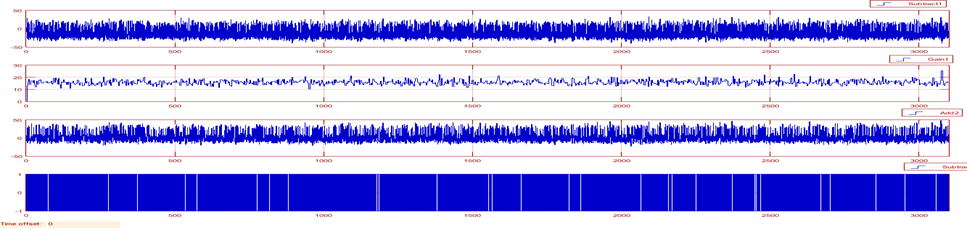
Fig. 14. Results after threshold SNR = 0
- Output signal results for determining threshold values.
- The results of the generator for determining the threshold values of the M-sequence code with output gain and the effect of the white noise signal amplifier (AWGN) = 0 for N = 31 ... 1000 Subtract.
- Results on the output of the signal on the Matched Filter.
- Signal input of the post-amplifier signal.
Case: SNR= -10.
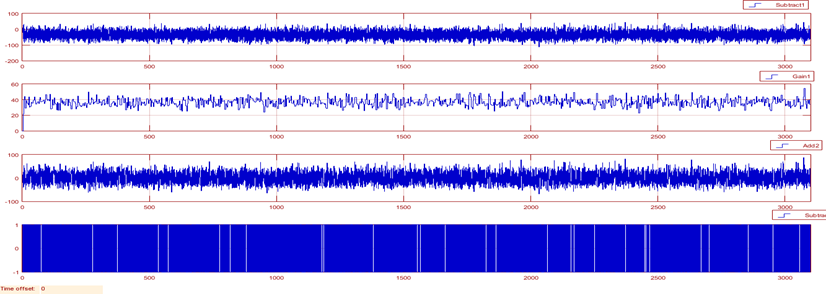
Fig. 15. Results after threshold SNR = -10
- Output signal results for determining threshold values.
- The results of the generator for determining the threshold values of the M-sequence code with gain at the output and the effect of the white noise-signal amplifier (AWGN) = -10 for N = 31 ... 1000 Subtract.
- Results on the output of the signal on the Matched Filter.
- Signal input of the post-amplifier signal.
5. Conclusions
Third generation mobile systems, already being developed within the framework of international European programs, will use broadband signals formed by pseudo-random sequences. In particular, the basic standard for UMTS (Universal Mobile Telecommunications System) was WCDMA or broadband CDMA, developed by Ericsson. There are more than twenty projects known to unite to some extent all the developed telecommunication firms and leading universities of the world, which from different sides are trying to approach the solution of the problem of global communications of the future.
A mathematical model is developed in the Mat lab environment, which allows receiving the responses of the matched FSB filters with bases from 7 to 31. The developed models allow estimating waveforms of signals. For different degrees of code, as well as the probability of false alarms and correct detection and estimate the threshold level for different code detection models.
At a threshold of 10 and a signal-to-noise ratio of -10 dB, the probability of erroneous detection of a wideband signal with base 31 was 0.1160, with an increase in the signal-to-noise ratio to -5 dB; the probability of erroneous detection was 0.0180.
At a threshold of 15 and a signal-to-noise ratio of -10 dB, the probability of erroneous detection of a broadband signal with base 31 was 0.1890, with an increase in the signal-to-noise ratio to -5 dB, the probability of erroneous detection was 0.0610.
With a threshold of 20 and a signal-to-noise ratio of -10 dB, the probability of erroneous detection of a broadband signal with base 31 was 0.2670, with an increase in the signal-to-noise ratio to -5 dB, the probability of erroneous detection was 0.1290.
The number of false emissions with a signal-to-noise ratio of -10 dB was 7946 for the threshold of 10, 5381 for the threshold of 15, 3445 for the threshold of 20. Thus, the choice of the detection threshold of wideband signals with base 31 is justified. It should be chosen equal to 20.
