.png&w=384&q=75)
Introduction
In recent years, additive manufacturing – particularly Fused Deposition Modeling (FDM) – has significantly influenced the design and production of functional components in mechanical engineering. PLA and ABS are among the most commonly used materials in FDM due to their processability and mechanical performance. PLA is known for its environmental friendliness, while ABS offers superior toughness and thermal resistance. This study investigates the mechanical behavior of PLA and ABS under uniaxial tensile and compressive loads. Standard specimens were fabricated using consistent FDM parameters, and mechanical testing followed ASTM D638 and ASTM D695 standards for tensile and compression evaluations, respectively. Unlike studies using simulations, this research relies solely on physical experiments to assess strength, stiffness, and deformation characteristics. The findings aim to guide engineers and designers in material selection and structural optimization for strength-sensitive applications in 3D printing, emphasizing the practical impact of process parameters on final mechanical performance.
Experimental Equipment and Testing Methodology
The primary objective of the experimental work was to evaluate the mechanical behavior of PLA and ABS polymer materials fabricated using 3D printing technology under applied mechanical loads. To assess the influence of various parameters on part strength and identify material differences, high-precision testing equipment was selected. All tests were conducted at the Production Directorate of Navoi Machine-Building Plant and the engineering laboratories of North University of China.
For this purpose, the Zwick/Roell Z010 universal testing machine was used. This device is equipped with high-precision force and deformation sensors and supports tensile, compressive, bending, and other mechanical tests for a wide range of materials. The machine is operated via the modern TestXpert II software, which enables real-time force and displacement monitoring, graphical representation, and data export in CSV, Excel, or PDF formats. The software also provides analytical tools such as filters, elasticity limits, and maximum force detection functions. Two types of tests were carried out. Tensile and compression tests were conducted according to the following standards: tensile testing was performed in compliance with ASTM D638 Type I standard. The samples used were flat specimens with a narrowed middle section, measuring 165×13×3.2 mm. Each specimen was clamped tightly between the jaws of the universal testing machine in a horizontal position. The load was applied vertically at a constant speed of 5 mm/min. During testing, the following parameters were recorded: maximum force (F_max, N), elongation at break (ΔL, mm), strain (ε, %), and Young’s modulus (E, MPa).
Compression testing followed ASTM D695 standard. The samples were cylindrical with dimensions of ø12.7 × 25.4 mm. Each specimen was placed vertically between two flat compression plates, and the load was applied at a speed of 2 mm/min. Key values recorded included maximum compressive force, the initial deformation point, and the onset of plastic flow. Force–deformation curves were constructed to visualize the mechanical response. All tests were conducted under standard laboratory conditions: a room temperature of 23 ± 2°C and relative humidity of 50 ± 5%. The test environment was protected from direct sunlight and external heat sources to maintain stability.
Prior to each test, the testing machine was calibrated, and three samples per parameter setting were tested. Following each measurement, force – deformation graphs were automatically generated in TestXpert. Defective, deformed, or irregular specimens were excluded from the results. Each sample was given a unique identification code (ID) and recorded in the test protocols. Additionally, the force sensor and platform were recalibrated after every five tests to ensure consistent accuracy.
Test results were exported in CSV format and analyzed using OriginPro 2021 software. Separate force – deformation curves were created for each material and parameter combination. These graphs allowed the determination of elasticity limits, peak force points, and onset of deformation. The behavior of PLA and ABS was compared using unified axes, enabling direct visual comparison. Scientific interpretation of observed differences was provided to clarify the effects of each parameter on mechanical performance. The systematic approach to experimental setup, environmental controls, equipment calibration, and testing methodology ensured the reliability and repeatability of all results. Every measurement adhered to international testing standards, forming a solid foundation for the analytical evaluation and scientific conclusions in the subsequent sections.
Experimental Results, Graphical Analysis, and Scientific Interpretations Tensile strength test analysis
During this phase of the study, the PLA and ABS polymer specimens were subjected to tensile testing in accordance with the ASTM D638 Type I international standard. The tests were conducted using the Zwick/Roell Z010 universal testing machine at a constant crosshead speed of 5 mm/min. Each specimen was mounted in a horizontal orientation, and load was applied vertically. Key mechanical parameters such as maximum force (F_max), elongation at break, strain, and Young’s modulus were evaluated from the resulting force – deformation curves.
PLA samples exhibited high initial stiffness and a distinct linear deformation phase. In particular, the specimens printed at an extrusion temperature of 210°C, with a layer height of 0.2 mm and 100% infill, demonstrated the highest resistance to applied force (F_max ≈ 54-55 MPa). The resulting graph displayed a sharp incline followed by a sudden drop, clearly indicating the brittle nature of the material. While an elastic deformation phase was present, the narrow plastic region caused rapid fracture without significant elongation. This makes PLA a suitable material for static-load-bearing structures where impact resistance is not a critical factor.
On the other hand, ABS samples showed slightly lower maximum force values (F_max ≈ 44–46 MPa), but their force – deformation curves extended further and featured a gradual transition into the plastic deformation zone. This shape suggests that ABS possesses higher toughness and can adapt to deformation over time. The graph indicated a steady increase in force from the elastic phase onward, reflecting the material’s ability to withstand prolonged strain before failure. Such behavior is advantageous in applications subjected to cyclic or dynamic loading where structural flexibility is essential.
The key distinction between PLA and ABS in the tensile tests lies in their response to deformation. PLA demonstrated a sharp peak and abrupt failure, highlighting its brittle character. In contrast, ABS showed a more gradual load increase and extended elongation before failure, marking it as a ductile and impact-resistant polymer. On the graphs, this contrast was evident: PLA displayed a short, steep curve, while ABS exhibited a longer, smoother trajectory.
These results suggest that although PLA can withstand higher peak loads, its brittleness makes it less suitable for environments requiring impact resilience. ABS, despite lower tensile strength, offers better plasticity and is therefore more appropriate for load-bearing applications exposed to dynamic forces. The tensile test provided a clear analytical basis for evaluating and comparing the structural behavior of both materials under mechanical stress.
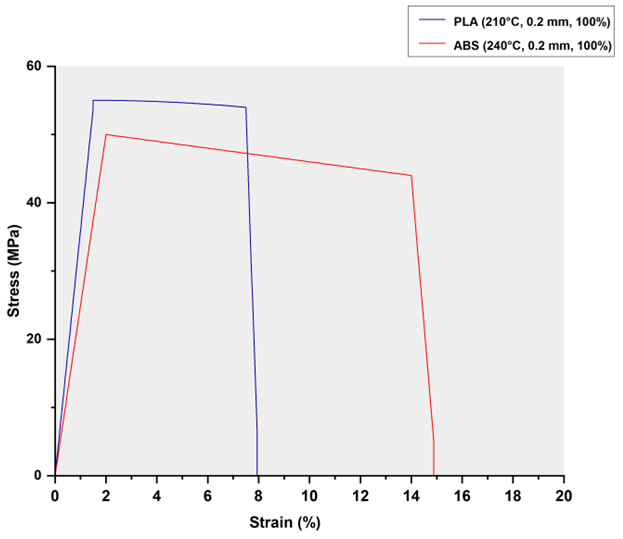
Fig. 1. Stress – strain curve of PLA and ABS polymer materials in tensile strength test
Compression Test Analysis
The compression testing of PLA and ABS polymer materials was conducted to investigate their deformation behavior under applied compressive loads. All tests were performed in accordance with the ASTM D695 international standard. The testing speed was maintained at 2 mm/min, and the results were assessed using stress – strain curves. For each material, the maximum compressive stress, strain at failure, and the onset of structural collapse were determined. During testing, PLA specimens initially exhibited an elastic response. As the load increased, minor shape changes occurred, but they remained fully reversible within the 1-2% strain range. Beyond this point, the curve rose sharply, indicating the transition into the plastic deformation zone. Owing to its high rigidity, PLA quickly reached its peak stress (approximately 33 MPa), followed by a sudden drop in the curve, signaling structural failure. This behavior was clearly identifiable as the beginning of fracture.
The stress – strain graph for PLA revealed a smooth, steep incline leading to the maximum point, followed by a rapid decline. This abrupt change is indicative of the material’s brittleness. In the final stage, the curve dropped to 0 MPa, marking the complete failure of the specimen – likely due to cracking or sudden collapse, resulting in the test termination. Such a curve represents classical brittle failure under compressive stress.
ABS, on the other hand, demonstrated entirely different characteristics. The initial increase in stress was more gradual, reflecting the material’s higher resilience in the elastic phase. Upon reaching around 4-5% strain, ABS transitioned into the plastic region. Despite continued deformation, the stress either plateaued or increased only slightly. The material reached its peak compressive stress near 42 MPa, after which the curve gradually declined, suggesting the development of microcracks, interlayer delamination, or other internal damage mechanisms.
Compared to PLA, the stress – strain curve for ABS was smoother and more extended, reflecting its superior plasticity, toughness, and capacity for deformation. At the end of the test, the curve tapered off toward 0 MPa, indicating full material softening and loss of structural integrity.
These results confirm that both materials exhibit distinct mechanical responses under compression. PLA is characterized by high stiffness and brittle behavior–it reaches maximum load quickly but cannot sustain it over time. ABS, by contrast, absorbs compressive loads more gradually and transitions into failure more slowly, making it better suited for long-term, dynamic loading environments.
The differences were clearly visualized in the stress – strain curves: PLA's curve featured a sharp peak and steep decline, while ABS displayed a wide, continuous arc with a more gradual descent. Such mechanical behavior highlights ABS as a preferable material for load-bearing applications requiring elasticity and energy dissipation, whereas PLA is more suitable for dimensionally accurate, short-term structures where high compressive loads are not sustained.
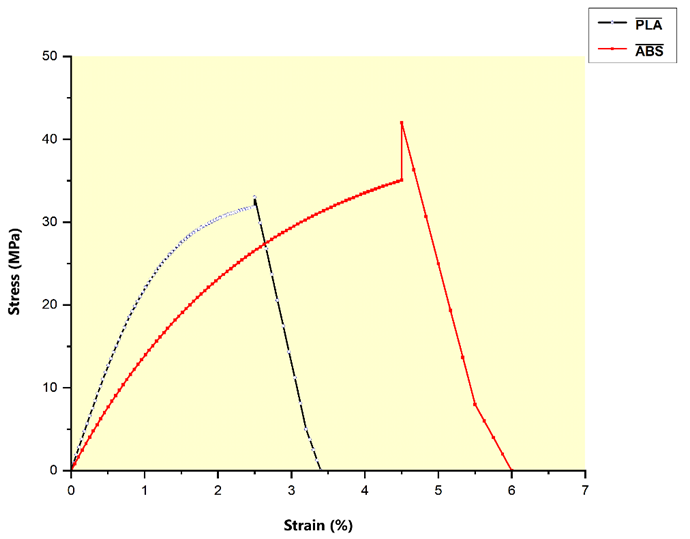
Fig. 2. Stress – strain graph of PLA and ABS specimens in compression test
Conclusion
The experimental analysis clearly reveals that PLA and ABS, though both widely used in FDM 3D printing, exhibit fundamentally different mechanical behaviors under tensile and compressive loads. PLA demonstrates higher tensile strength and stiffness, yet its brittle nature results in abrupt failure with limited plastic deformation. This makes PLA better suited for static applications where rigidity and dimensional precision are essential, but impact or dynamic stress is minimal.
Conversely, ABS shows superior ductility and energy absorption under both tensile and compressive conditions. Its stress – strain curves feature a broader plastic region and gradual failure, indicating better performance in dynamic or cyclic loading environments. In compression testing, ABS also achieved higher peak stress and showed more stable deformation, reinforcing its potential for load-bearing and impact-sensitive applications.
Ultimately, the material choice for 3D printed components must align with specific functional requirements. PLA is optimal for aesthetic or precision components, while ABS is preferable in mechanically demanding settings where toughness and flexibility are critical. The study emphasizes that optimizing print parameters and understanding material-specific responses are vital for achieving reliable mechanical performance in additive manufacturing.
