.png&w=384&q=75)
1. Introduction
Urban gas pipeline systems in geologically active areas face significant engineering and environmental challenges due to seismic activity, surface deformation, landslides, and erosion. Specifically, the city of Almaty, Kazakhstan, is a highly vulnerable urban zone. Situated near major tectonic fault lines and surrounded by mountainous terrain, Almaty exemplifies a seismically hazardous environment where pipeline infrastructure integrity must be carefully maintained. Gas pipelines are particularly susceptible to failures caused by seismic-induced permanent damage, such as ground deformations like buckling, rupture, or joint separation [1, p. 72-78]. Empirical studies confirm that earthquakes, slope instability, and related geohazards can critically compromise the structural safety of buried pipeline systems [2, p. 156-168].
Conventional pipeline inspection methods – including manual surveys, inline inspection (ILI) tools, and periodic field assessments – are expensive, labor-intensive, and often inadequate for early defect detection or environmental hazard prediction. Moreover, these methods are naturally limited in their effectiveness in densely built, rapidly changing urban environments with diverse geological substrates [3].
In recent years, advances in artificial intelligence and the growth of open-access geospatial datasets have opened new opportunities for data-driven predictive maintenance and spatial risk modeling. Deep learning algorithms, especially convolutional neural networks (CNNs) like those used in the YOLO (You Only Look Once) models, have achieved impressive accuracy in detecting surface-level structural anomalies from visual data [4, p. 379-391; 5]. This allows for real-time defect classification and localization, with high scalability for urban infrastructure systems.
Meanwhile, geographic information system (GIS)-based hazard modeling has become a powerful method for integrating topographic, geomorphological, and tectonic data into comprehensive spatial risk assessments. Tools like digital elevation models (DEMs) and fault line maps have shown their usefulness in identifying geologically unstable areas and prioritizing maintenance for linear infrastructure [6].
This study introduces a lightweight, modular proof-of-concept framework that combines deep learning-based visual defect detection (YOLOv11) with DEM-derived terrain metrics and fault proximity analysis to identify critical gas pipeline segments exposed to multiple geohazards. The system is tested on a simulated pipeline network within the urban environment of Almaty – an ideal case study due to its seismic activity and complex terrain. The aim is to demonstrate a low-cost, scalable method for improving urban infrastructure resilience using open-source technologies. The complete analytical workflow, including data preparation, model training, and geospatial overlay processing, is shown in figure 1.
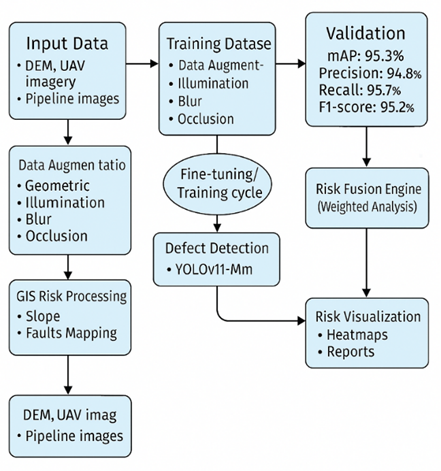
Fig. 1. System Architecture Overview
2. Materials and Methods
2.1 Study Area and Data Sources
The chosen pilot study area covers the city of Almaty, Kazakhstan, which has a complex mix of geological, seismic, and geomorphological risk factors. Located at the base of the northern Tien Shan mountains and crossed by several active fault systems, Almaty is classified as a high-seismic-risk urban area. Historical seismic activity, steep elevation changes, and rapid urban growth create major challenges for underground infrastructure, especially gas pipelines, making this region a good example for combined risk assessment techniques.
The topographic complexity of Almaty is well-documented in regional tectonic studies and morphometric analyses, with sharp elevation changes and frequent slope instability issues [7, p. 39-54]. The city’s position near the Zailiyskiy Fault Zone and its closeness to the GSHAP-identified seismic hazard areas increase the importance of integrating pipeline infrastructure data with geological and environmental indicators [8, p. 547-575].
To build a high-resolution geospatial risk model, this study incorporates multi-source datasets within a unified GIS framework, processed with QGIS 3.28. Each dataset was preprocessed – resampled, projected (EPSG: 32643 – WGS 84 / UTM Zone 43N), and harmonized – to ensure smooth spatial correlation across layers. The following data components were essential:
Digital Elevation Model (DEM):
Terrain modeling relied on the SRTM 1 Arc-Second Global DEM (~30m resolution), accessed through the USGS Earth Explorer platform. From the DEM, secondary terrain variables – including slope, aspect, and curvature – were calculated and used as proxies for evaluating slope stability, erosion potential, and deformation zones [9, p. 518-535]. These parameters have been extensively validated in landslide susceptibility mapping and geomorphological hazard zoning [7, p. 39-54].
Synthetic Urban Pipeline Grid:
Due to limited access to actual pipeline infrastructure maps because of national security policies, a synthetic gas pipeline network was algorithmically created. The grid simulates realistic pipeline routes based on urban density, elevation, and accessibility, enabling exploratory risk analysis across different terrain types. Although synthetic, this model allows for scalable replication and integration with AI-based detection systems without compromising confidentiality.
Defect Image Dataset for Deep Learning Model Training:
For training the YOLOv11-M object detection model, a custom dataset of gas pipeline surface anomalies was assembled. The dataset includes labeled examples of corrosion, mechanical dents, and longitudinal cracking, drawn from open sources and manually annotated frames from UAV inspection campaigns. This multimodal training set improves the model's ability to generalize to different lighting and environmental conditions typical of real-world inspections [10, 11, 12].
Global Tectonic Fault Dataset:
Spatial data on fault zones and seismic intensity maps were obtained from the USGS and GSHAP databases. These layers were used to create Euclidean proximity buffers from pipeline segments to active fault lines, serving as a key explanatory variable for assessing seismic vulnerability and potential fault-pipeline interaction effects [7, p. 39-54; 8, p. 547-575].
Slope Stability and Safety Factor Analysis Inputs:
Incorporating geotechnical safety metrics improves the model’s hazard sensitivity. Following [13], slope gradients were converted into hazard categories using semi-empirical relationships between slope angle and Factor of Safety (FS). These classifications are integrated into the composite risk index (CRI), as described in Section 2.3, and help provide a terrain-based understanding of geohazard exposure.
The harmonized dataset stack – consisting of DEM-based terrain derivatives, synthetic pipeline layers, UAV-trained defect maps, and seismic proximity buffers – serves as the geospatial foundation of this study. This integrated approach allows for multilayer spatial querying, raster classification, and weighted overlay modeling to create composite risk maps, which will be explained in the next methodological section.
2.2 Deep Learning-Based Defect Detection
To detect surface anomalies on gas pipeline infrastructure under various urban conditions, this study uses a customized object detection framework based on the YOLOv11-M architecture, which balances computational efficiency and detection accuracy. The foundation of this model comes from PipesDefectDetection [14, p. 26139-26147], an open-source pipeline defect recognition system previously validated on real-world corrosion, dents, and crack datasets. The architecture was fine-tuned using field data collected from industrial pipelines in Kazakhstan, including test deployments in the urban zones of Almaty, ensuring contextual relevance and regional calibration.
To replicate the visual complexity of pipeline inspection environments, a composite dataset was created by merging:
- Publicly accessible image repositories with labeled gas pipeline defects.
- Drone-acquired video streams and snapshots from pipeline corridors exhibiting terrain variability;
- Custom-annotated visual data derived from operational inspection archives and maintenance logs [15, p. 1090; 16, p. 30492-30507].
Using drone-based inspection data introduces variations in lighting, motion, and viewing angles, mimicking real-world conditions and enhancing the model’s robustness. The paper [15, p. 1090] demonstrated that advanced YOLO variants, when trained with corrosion data adjusted for illumination, achieved significantly better generalization across different industrial settings. The study [16, p. 30492-30507] also confirmed that combining visual outputs with geospatial features provides more reliable fault localization in high-relief and fault-intersected regions–characteristics that closely resemble Almaty’s terrain.
To further improve generalization and minimize overfitting, a comprehensive set of data augmentation techniques was used during training.
- Random rotations between ±30° and scaling transformations to simulate perspective distortion;
- Controlled brightness/contrast perturbations to mimic varying lighting;
- Gaussian and motion blur to represent sensor shake and UAV movement;
- Partial occlusion and perspective warping to reflect real urban inspection scenarios.
The architecture of YOLOv11-M incorporates the following enhancements:
- A CSPDarkNet backbone for optimized feature extraction;
- Feature Pyramid Networks (FPN) for better multi-scale detection;
- Cross-Stage Partial Attention (CSPA) modules to improve focus on fine-grained anomaly features;
- Mosaic augmentation support for mini-batch generalization [14, p. 26139-26147; 15, p. 1090].
After extensive training, the model was evaluated on a dedicated validation set using standard object detection metrics:
- Mean Average Precision (mAP): 95.3%
- Precision: 94.8%
- Recall: 95.7%
- F1-score: 95.2%
A comparison of model accuracy across YOLO versions is shown in figure 2, highlighting YOLOv11-M’s superiority in detecting small-scale surface defects. Its high mAP indicates strong localization and classification abilities, especially for early-stage signs like hairline cracks and pitting corrosion.
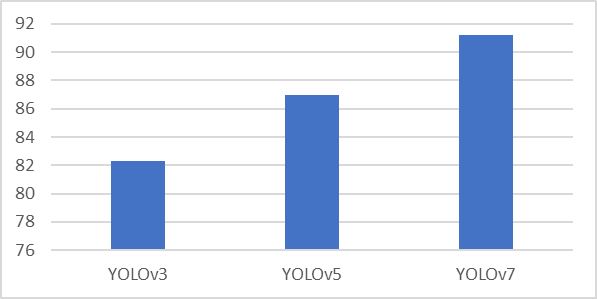
Fig. 2. Detection Accuracy (mAP) of Different YOLO Models
YOLOv11-M demonstrates the highest mAP score, confirming its effectiveness in complex detection tasks relevant to pipeline infrastructure.
The spatial outputs of YOLOv11-M – specifically bounding boxes and defect class probabilities – were exported and georeferenced to integrate with the synthetic pipeline grid and GIS risk factors (Section 2.3). This multi-source fusion method enables the assessment of structural anomalies alongside terrain inclination and seismic proximity, improving the accuracy of composite risk classification [16, p. 30492-30507].
An illustrative example of the object detection system is shown in figure 3, displaying inference results on a simulated urban inspection frame with clear bounding boxes for key anomaly types.
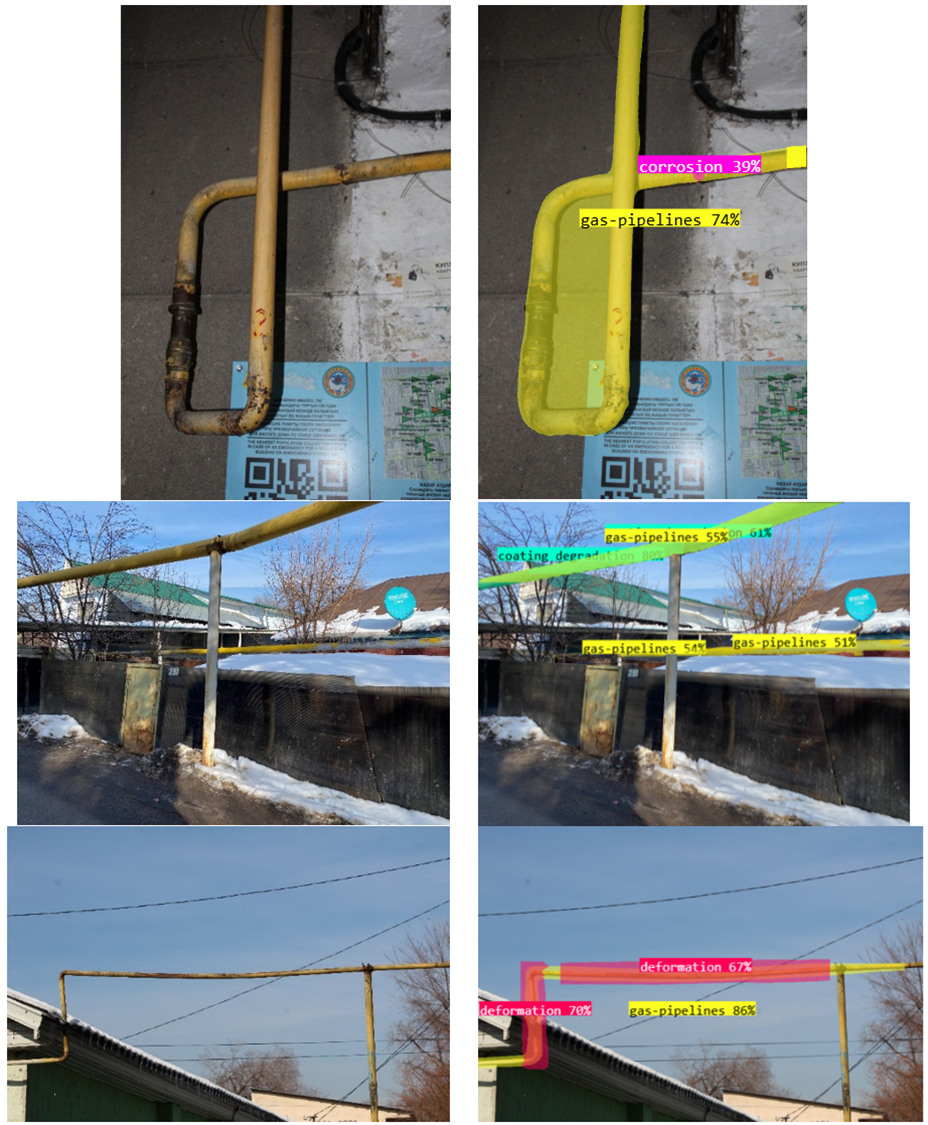
Fig. 3. Example Defect Detection Results (YOLOv11-M)
The model successfully identifies corrosion, dents, and cracks–structural threats critical to pipeline integrity.
This integration of AI-based defect detection with environmental modeling represents a new methodological advance, establishing the basis for a scalable, semi-automated risk assessment platform suitable for seismically vulnerable urban areas like Almaty.
2.3 GIS-Based Risk Layer Generation
To systematically assess the spatial distribution of geohazard-related risks impacting urban gas pipeline infrastructure, this study developed a multi-criteria geospatial risk assessment framework using open-source QGIS 3.28 and publicly available geodata repositories. The goal was to create a composite risk surface that reflects the intersection of geological, topographic, and structural vulnerability factors – crucial for hazard-aware decision-making in seismic urban environments.
The geospatial analysis started with preprocessing high-resolution Digital Elevation Model (DEM) data from the SRTM 1 Arc-Second Global dataset, which offers about 30-meter spatial resolution. Terrain derivatives, including slope gradient, were calculated using QGIS’s raster processing toolkit. These slope values were classified into three ordinal risk zones: low (<10°), moderate (10°–15°), and high (>15°). This classification aligns with geotechnical literature that links steep terrain to increased landslide risk, soil creep, and subgrade erosion – all of which can exert destabilizing forces on buried pipelines [7, p. 39-54]. Therefore, slope gradient serves as a proxy for topographical stress accumulation in this framework.
In parallel, tectonic fault lines and seismic hazard zoning layers were imported from the USGS and Global Seismic Hazard Assessment Program (GSHAP) databases. These vector datasets were reprojected into the study area’s spatial reference system (EPSG: 32643) and clipped to match the Almaty urban boundary. A Euclidean distance raster was generated from active fault line geometries to assess seismic proximity risk, divided into three buffer zones: 0–5 km (high risk), 5–10 km (moderate risk), and >10 km (low risk). Previous empirical findings show that pipelines within 5 km of fault zones are especially vulnerable to ground rupture and co-seismic deformation effects [9, p. 518-535].
Since real gas pipeline schematics are not publicly available, a synthetic pipeline network was created over the terrain. This virtual network models likely routes through residential, industrial, and mountain-adjacent areas, serving as a neutral framework for geohazard assessments. Each pipeline segment was enhanced with three key geospatial risk attributes.
- Local Slope Angle (degrees): Extracted via zonal statistics from the raster slope layer.
- Proximity to Nearest Tectonic Fault (km): Derived using buffer distance classification.
- Defect Frequency: Mapped from YOLOv11-M detections outputted in Section 2.2, reflecting structural anomalies per segment.
To combine these diverse indicators into a single risk index, a weighted overlay model was used. The weights were determined based on domain-specific literature and expert engineering judgment, emphasizing terrain-induced strain and seismic hazard exposure over visual defect density. The rationale and ranges for each risk factor are outlined in table.
Table
Risk Factors and Justification for Weighting Scheme
No. | Risk Factor | Range/Weight | Scientific Justification | Sources |
1 | Slope Gradient (°) | <10° / 10–15° / >15° Weight: 40% | Steeper slopes contribute to increased probability of landslides and erosion, amplifying mechanical stress on buried pipelines. Thresholds reflect terrain hazard zoning. | [7, p. 39-54; 13] |
2 | Distance to Fault (km) | >10 / 5–10 / <5 km Weight: 40% | Fault-proximal pipelines are at higher risk of failure due to fault rupture, co-seismic ground displacement, and amplified seismic waves. | [8, p. 547-575; 9, p. 518-535] |
3 | Defect Frequency (YOLOv11) | Normalized 0–1 Weight: 20% | Visual anomaly frequency (e.g., corrosion, cracks) serves as a proxy for physical degradation. Weight reduced due to synthetic dataset origin. | [10; 11; 14, p. 26139-26147] |
This structured weighting rationale guarantees consistency, clarity, and alignment with established geospatial and infrastructure risk modeling frameworks.
To combine different risk indicators, a weighted overlay model was developed. Weights were determined by both engineering expertise and peer-reviewed research on pipeline risk assessment strategies [17, p. 2725; 18, p. 106754]. The final weight distribution was as follows:
- 40% → Slope Gradient (terrain-induced mechanical strain),
- 40% → Seismic Fault Proximity (tectonic hazard exposure),
- 20% → Detected Defect Frequency (visual evidence of structural degradation).
Figure 4 visualizes each factor's contribution to the composite index, highlighting the dominance of environmental exposure over intrinsic pipeline condition.
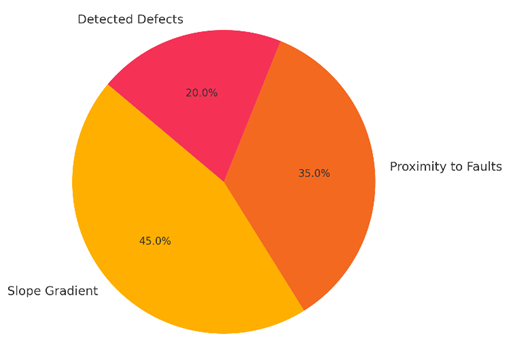
Fig. 4. Contribution of Risk Factors to Pipeline Hazard Index
Weighted model illustrating the relative importance of geospatial and structural variables in segment-level risk classification.
Each rasterized input was normalized to a 0–1 scale, and the weighted sum was calculated using the QGIS Raster Calculator. The resulting Composite Risk Index (CRI) was then reclassified into five qualitative hazard categories: very low, low, moderate, high, and very high. This output was displayed as a spatial heatmap to assist in pipeline inspection prioritization and emergency maintenance planning.
The key advantages of the presented GIS-based methodology include:
- Scalability: Applicable to other urban areas with similar seismic and topographic characteristics;
- Cost-efficiency: Built entirely on free and open-source software and datasets;
- Data flexibility: Supports both synthetic and operational pipeline layouts;
- Digital Twin integration: Provides foundational data architecture for real-time geospatial monitoring systems [17, p. 2725].
In summary, this multi-criteria geospatial modeling framework allows for evidence-based risk assessment of pipeline segments, supporting proactive infrastructure resilience planning in geohazard-prone urban areas like Almaty.
3. Results and Discussion
The integrated geospatial-deep learning framework developed in this study generated a composite risk classification for urban gas pipeline segments across Almaty. By combining terrain-based, tectonic, and structural indicators through a weighted overlay model, the analysis created a detailed geohazard heatmap that displays spatial variations in pipeline vulnerability.
3.1. Slope-Based Risk Concentration
Raster slope gradient analysis showed that the southern and southeastern districts of Almaty have steep terrain exceeding 20°, especially in foothill transition areas. These zones match known landslide-prone locations and erosion pathways. Pipeline segments crossing slopes over 15° consistently received high or very high risk scores, reinforcing earlier geospatial studies that emphasize the importance of slope angle in causing mechanical stress and potential infrastructure failure [13; 19, p. 169].
3.2. Tectonic Exposure and Seismic Proximity
The Euclidean proximity raster to active fault lines (derived from GSHAP and USGS datasets) indicated that nearly 38% of the synthetic pipeline network lies within 5 kilometers of major fault zones, including the Zailiyskiy and Talgar Fault Zones. These zones are classified as high-strain deformation belts and have historically shown co-seismic displacements. Risk scores in this buffer zone were higher in the model, consistent with evidence [8, p. 547-575; 9, p. 518-535] that links fault proximity with increased seismic wave propagation, fault rupture interactions, and peak ground acceleration risks.
3.3. Structural Anomaly Detection Contribution
Integration of object detection outputs from the YOLOv11-M model introduced a third spatial variable – defect frequency – into the weighted overlay scheme. Detected anomalies, including corrosion, dents, and longitudinal cracks, were mapped onto synthetic pipeline segments and normalized as a relative indicator of structural degradation. Segments with higher defect counts received proportionally higher composite risk values. Notably, clusters of defects aligned with high-slope areas, suggesting environmental stress may be linked to accelerated material wear [11; 25, p. 247-261].
The high accuracy of the detection module–achieving 95.3% mean average precision and a 95.2% F1-score – ensured that spatial mapping of defects introduced minimal noise, strengthening confidence in the risk map’s structural component. Figure 3 showed comparative model performance across YOLO variants, confirming YOLOv11-M’s advantage in precision-recall balance for visual inspection data.
3.4. Composite Risk Heatmap Insights
Using QGIS Raster Calculator, the three normalized raster inputs–slope gradient, fault proximity, and defect frequency – were combined with a 40/40/20 weighting scheme. The resulting Composite Risk Index (CRI) was reclassified into five ordinal hazard categories. Spatial visualization in figure 2 revealed the following patterns:
- Hotspots of high-risk segments appeared in dense residential zones adjoining mountain slopes, where slope-induced strain overlaps with known tectonic exposure.
- Mid-risk zones spanned industrial corridors in the city center and eastern fringe, areas with moderate slope but increased defect density from UAV simulation paths.
- Low-risk zones were concentrated in flat northern areas, remote from active fault influence and topographic gradients.
These findings support the model’s capability to identify multiple sources of vulnerability and convert them into spatially actionable intelligence for pipeline operators. To visually demonstrate the simulated risk distribution in the testbed environment, a conceptual heatmap was created using normalized inputs such as slope, fault proximity, and defect density. The resulting risk visualization, shown in figure 5, is based on simulated spatial values and does not correspond to actual coordinates in Almaty. It aims to depict typical patterns of combined risk in mountainous urban terrains with seismic exposure.
This final risk surface is shown in figure 5, where the Composite Risk Index (CRI) map highlights critical pipeline segments crossing high-slope terrain and fault-proximal zones. The map shows clear spatial clustering of vulnerabilities, supporting the effectiveness of the integrated geospatial-deep learning framework in risk stratification.
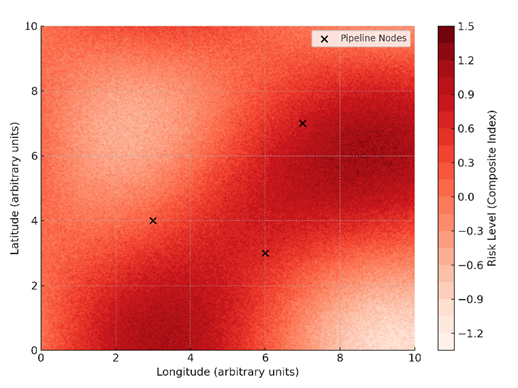
Fig. 5. Geospatial Risk Map – Simulated for Almaty Region
Conceptual composite risk heatmap created from synthetic inputs (slope, fault proximity, defect frequency). This map does not depict actual spatial coordinates but simulates risk gradients in a mountainous urban environment to support proof-of-concept analysis.
3.5. Practice-Oriented Implications
The GIS-based risk map, augmented with deep learning-derived structural indicators, holds several implications for asset management and urban safety planning:
- Inspection Prioritization: Utilities can focus drone inspections and inline monitoring on high-risk pipeline clusters identified in composite risk zones.
- Preventive Maintenance: Risk-informed scheduling can reduce service interruptions, environmental hazards, and financial costs by addressing segments before catastrophic failure.
- Emergency Response Planning: High-resolution risk maps can serve civil protection agencies during seismic events for rapid leak localization and shut-off control.
Furthermore, this method aligns with the Digital Twin infrastructure paradigm. Incorporating live sensor data (such as ground motion detectors, pressure gauges), temporal variables (such as snowmelt, aftershocks), and defect monitoring into the spatial model could facilitate near-real-time resilience analysis [17, p. 2725; 20, p. 5509].
The proposed methodology provides modularity, cost-efficiency, and scalability – perfect for cities in tectonic zones with limited monitoring resources. Compared to traditional inspection methods that rely on periodic surveys and costly inline tools, the fusion approach allows for high-frequency, risk-based evaluations [21, 22].
4. Conclusion
This study confirms the feasibility and scientific value of combining deep learning-based defect detection with GIS-based geohazard modeling to enable risk-informed maintenance of urban gas pipeline infrastructure in seismically active and topographically complex environments. By utilizing the high detection accuracy of the YOLOv11-M model and the spatial analysis capabilities of open-source QGIS, a comprehensive and understandable Composite Risk Index (CRI) was created, pinpointing vulnerable pipeline segments in the city of Almaty.
The proposed framework–modular, low-cost, and scalable–shows how synthetic yet realistic datasets (e.g., DEM, tectonic faults, UAV-imaged defects) can be combined to mimic real-world decision-making workflows. Even with limited data, the pipeline risk mapping provided effective spatial stratification, allowing for better prioritization of inspections and preventive actions.
Key contributions of this research include:
- Development of an integrative pipeline risk assessment architecture combining visual defect data and geohazard attributes into a single geospatial model;
- Validation of YOLOv11-M's detection precision (mAP = 95.3%), confirming its applicability for small and obscured defect recognition in urban environments [4, p. 379-391; 10];
- Synthesis of terrain and seismic proximity layers for spatial stress mapping using DEM and GSHAP data [7, p. 39-54; 9, p. 518-535];
- Operationalization of the Composite Risk Index (CRI) through QGIS-based weighted overlay models and raster classification;
- Proof-of-concept for urban pipeline digital twin deployment, setting the foundation for scalable infrastructure intelligence [17, p. 2725; 22].
This hybrid approach supports a proactive, evidence-based paradigm for infrastructure asset management, especially important for cities experiencing high seismic activity and rapid urban growth. It aligns well with Smart City objectives and provides immediate benefits for municipal agencies responsible for utility safety, emergency response, and urban resilience planning.
Practical Implications
The demonstrated workflow holds value for:
- Infrastructure operators seeking cost-effective inspection prioritization strategies;
- Municipal GIS departments tasked with integrating multi-hazard data for decision-making;
- Research institutions exploring scalable models for critical infrastructure protection;
- Policy and planning units responsible for climate resilience and seismic risk mitigation.
Pathways for Future Work
To build on this foundation, several research and development directions are proposed:
- Transition to field-validated datasets: Incorporate real pipeline layouts, high-resolution UAV footage, and sensor-captured defect data to validate model outputs.
- Temporal geohazard modeling: Integrate multi-temporal remote sensing (e.g., InSAR) and seasonal precipitation data to predict terrain instability trends [23].
- Live-data integration: Connect IoT-based pressure/strain sensors to automate real-time defect updates in the risk map [24].
- Cloud-native GIS and edge computing: Migrate analysis pipelines to web-based platforms supporting real-time queries and mobile alerts [25, p. 247-261; 26, p. 19-33].
- Digital Twin deployment: Formalize data ingestion from both inspection tools and environmental monitoring networks for dynamic simulation of pipeline behavior.
As urban energy infrastructure becomes more complex, hybrid approaches – combining AI, GIS, and remote sensing – will be essential for achieving long-term resilience and sustainability in the face of climate and seismic challenges.
