.png&w=384&q=75)
1. Introduction
The purpose of this work is to study the concept of humanization of the economy in the context of its basic principles, to analyze the possibilities and barriers of humanization of the economy in the conditions of the modern world, and to find answers to the following practical questions:
- Are there any examples in the world of countries with a humanized economy?
- Is the humanization of the economy compatible with further effective growth of the country's economy, or is it a factor hindering economic development?
- At what stage of a country's political and economic development does economic humanization become possible?
The relevance of this study is determined by the need to find new approaches to solving global problems caused by the traditional model of economic growth, focused primarily on GDP growth, profit maximization, and production efficiency, which often leads to increased social polarization, environmental degradation, and loss of moral guidelines.
The object of the study is the modern economic system as a set of institutions, mechanisms, and processes that form the basis of social development.
The subject of the research is the processes of humanization of the economy, their impact on the functioning of economic systems, and the possibility of their implementation on a global scale.
The study's hypothesis is as follows: economic humanization is a realistic and effective development path for various countries, contributing to improved quality of life and social justice. However, its implementation requires overcoming significant institutional and cultural barriers. At the same time, there is a risk that economic humanization is a utopian concept without realistic tools for implementation.
In accordance with the set goal, the following tasks were solved:
- Study of the concept of humanization of the economy in the modern world;
- Analysis of the basic principles of humanization of the economy and their impact on sustainable development and social well-being of economies and societies;
- Identification of limitations and barriers to the processes of humanization of the economy;
- Formation of conclusions based on the conducted research.
The research methods were:
- Quantitative methods – collection and analysis of numerical data, statistical analysis, identification of patterns and trends;
- Correlation analysis – the study of the relationship between variables;
- Comparative analysis – a phenomenon, event, or object is compared with a similar one;
- Systems analysis – the construction of a system with a certain interrelationship and hierarchy of elements, the definition of key functions, system-forming and system-destroying factors.
To collect numerical and statistical data, a sample of 15 countries with different territorial, climatic, religious, economic, and other features, with different types of state and political systems was formed. Numerical data were collected for 2022 from reports, papers, and publications of international agencies, government bodies, and national reports of various departments (information sources are provided after each table). It should be noted that data may vary slightly between different sources. This study prioritizes the order of the numbers and the overall hierarchy of values, rather than specific numerical values.
2. The main part
2.1. The concept of humanization of the economy. Basic principles and barriers to implementation
The humanization of the economy is a concept aimed at reorienting the economic system from a focus solely on material benefit to ensuring sustainable and equitable development focused on human capital, fundamental human values, well-being, and the comprehensive development of the individual. At the center of this concept is the individual, not capital or technology. The key idea is: the economy should serve the people, not the people serve the economy.
At its core, the concept of humanization of the economy is a synthesis of ideas from economics, sociology, psychology, and philosophy. This concept has no single founder. It matured in the second half of the 20th century as a response to growing inequality, environmental problems, and the sense of futility of the consumption model.
The following scientists and organizations made a significant contribution to the concept of humanization of the economy:
- Gary Becker (1992 Nobel laureate in economics) formalized the concept of "human capital," insisting that investments in education, health, and knowledge increase productivity and human income and are a key factor in economic growth.
- Amartya Sen (1998 Nobel laureate in economics) proposed the concept of "development is not the growth of wealth, but the expansion of freedom," which emphasizes the need to expand people's real freedoms and opportunities to lead the lives they value. His ideas formed the basis of the UN Development Programme's Human Development Index, which has become a practical indicator of humanization.
- Richard Easterlin (economist, author of the famous 1974 article “Does Economic Growth Improve The Human Lot? Some Empirical Evidence") argued that economic growth beyond a certain point does not lead to an increase in the happiness of its citizens. His "Easterlin paradox" led to the emergence of "happiness economics" and such indicators as "gross national happiness" and the "better life index."
- Karl Polanyi (economist, anthropologist), in his 1944 book “The Great Transformation: The Political and Economic Origins of Our Time”, insisted that the market, without state intervention, tends to subjugate people and nature, treating them as commodities, which destroys the very “fabric” of society. He argued that the economy should be integrated into social relations, vice versa. His ideas became the theoretical basis for social economics and cooperatives.
- Muhammad Yunus (2006 Nobel Peace Prize laureate) coined the concept of microcredit and social business. He believed that business can and should solve social problems. Social business, where profits are reinvested in social goals rather than paid out to shareholders, is a practical tool for humanizing the economy at the micro level.
- The works of Abraham Maslow (hierarchy of needs), Carl Rogers, and Erich Fromm shifted the focus to self-realization and full personal development.
- The Brundtland Commission (UN World Commission on Environment and Development) examined the limits of economic growth in terms of environmental impacts, developed the concept of sustainable development and meeting the needs of the present without a threat to future generations. This concept has become an integral part of humanization, linking human well-being with the health of the planet.
Thus, the basic consolidated principles of humanization of the economy were formed:
1. Man is the main value:
- The economy must contribute to improving the quality of life, not just GDP growth;
- Not only material goods are important, but also education, healthcare, culture, and ecology are important too;
- Resources should be invested in the development of human capital: in education, science, creativity, and the creation of conditions for people’s self-realization.
2. Social justice:
- Reducing inequality, fair distribution of income.
- Availability of basic goods (housing, medicine, education) for all segments of society.
3. Caring for future generations as a guarantee of sustainable long-term development:
- Balance between economic growth and ecology through the development of “green ecology” and the use of renewable energy sources.
- Abandoning the mindless exploitation of resources in favor of long-term well-being.
4. Ethics in business and democratization:
- Corporate social responsibility.
- Refusal of labor exploitation in favor of decent working conditions.
Despite the obvious benefits of humanization of the economy for society, E. V. Smirnova (Russian economist, specialist in regional economics and spatial development) rightly notes that “there are significant obstacles that limit its implementation in some regions” [1, p. 58-61].
According to various sources, the key barriers to the humanization of the economy are the following:
- One of the main barriers is the economy's dependence on raw materials. I. Komkov, V. V. Sutyagin, and N. N. Volodina (Russian economists and analysts specializing in macroeconomics, industrial policy, technological development, and, in particular, the “resource curse”) note that "in countries with a high share of income from oil and gas exports, incentives for investment in human capital often remain weak" [2, p. 107-112].
- N. Kan, V. I. Trunin, and N. V. Sopina (Russian economic analysts specializing in macroeconomic policy, monetary regulation, and forecasting) note that “rigid bureaucracy is also a serious obstacle to the humanization of the economy. State control over many areas often limits civil initiatives from below” [3, p. 57-62]. Instead of supporting cooperatives or social entrepreneurship, bureaucratic structures often create additional barriers to their development.
- Corruption and inequality undermine the effectiveness of social programs and hinder the fair distribution of resources.
In conclusion of the general description of the concept under consideration, it should be noted that the question of the advisability of humanization of the economy gives rise to many discussions. Critics of the humanization of the economy (Milton Friedman, Arthur Laffer, Daron Acemoglu), who believe that humanization can reduce competitiveness and growth rates, usually argue their position by the fact that:
- Social spending and taxes reduce investment;
- Strict labor laws reduce market flexibility;
- Business is losing its competitiveness on a global level.
Advocates of humanization (for example, Joseph Stiglitz, Thomas Piketty) acknowledge these risks, but argue that they can be minimized through thoughtful reforms.
2.2. Formation of country sample for the study and of their basic characteristics list
To conduct a comprehensive and objective study, a sample of 15 countries with different territorial, climatic, religious, economic, and other features, with different types of state and political systems was formed. Tables 1 and 2 were compiled for these countries, reflecting key country characteristics relevant to the main topic of this study:
- The ability to invest in a country's human capital and ecology is linked, among other things, to the availability of such financial resources. As a key characteristic of the availability of this opportunity in a country, the level of GDP per capita at purchasing power parity was chosen, which in turn may depend on the period of time that has passed since the beginning of the industrialization of the country's economy (time resource), and the type of the country’s economy itself.
- Social justice and democratization in business are usually characterized by the type of political system of the country and the period of existence of this type of political system - an indicator of the stability of the regime.
- Barriers to the humanization of the economy stem from the same type of political structure of the country, the type of economy, and dependence on raw materials exports.
The general data collected across countries will be referenced and selectively duplicated within the framework of the analysis of various principles of humanization of the economy and barriers to its development.
Table 1
Type of political regime and duration of the current regime
Country | Type of political regime | Duration of the current regime, years |
Sweden | Developed stable democracy | 100+ |
Norway | Developed stable democracy | 100+ |
Germany | Developed stable democracy | 75 |
France | Developed stable democracy | 65+ |
USA | A developed stable democracy (with elements of oligarchy, fusion of business and government) | 230 |
Russia | Authoritarian regime (after a long totalitarian-authoritarian regime and a short period of fragile democracy) | 20 |
Poland | Stable democracy | 35 |
Peru | Fragile democracy (unstable) | 20 |
Chile | Stable democracy | 35 |
Venezuela | Authoritarian regime (with dictatorial features) | 25 |
China | Authoritarian regime | 70+ |
Japan | Developed stable democracy | 75+ |
India | Fragile democracy (with signs of authoritarianism) | 75+ |
UAE | Authoritarian regime (absolute monarchy) | 50+ |
Saudi Arabia | Authoritarian regime (absolute monarchy) | 90+ |
Table 2
Year of industrialization (approximate), GDP per capita PPP, type of economy, and share of raw material exports in GDP for 2022 according to World Bank Group and Observatory of Economic Complexity
Country | Period since the beginning of industrialization, years (year of beginning) | GDP per capita PPP, $ (2022) | Type of economy | Share of raw materials exports in GDP, % (2022) |
Sweden | 132 (1890) | 62,926 | Diversified (highly diversified, high-tech, post-industrial) | 5–7 |
Norway | 117 (1905) | 89,114 | Diversified with the raw materials sector | 15 |
Germany | 151 (1871) | 63,150 | Diversified (highly diversified, industrial) | 2-3 |
France | 174 (1848) | 55,493 | Diversified (highly diversified, post-industrial) | 1-2 |
USA | 157 (1865) | 76,399 | Diversified (highly diversified, post-industrial) | 2-3 |
Russia | 137 (1885) | 35,865 | Raw materials (oil and gas) | 15–20 |
Poland | 72 (1950) | 45,343 | Diversified (industrial) | 5–7 |
Peru | 72 (1950) | 15,893 | Raw materials | 10 |
Chile | 83 (1939) | 28,526 | Raw materials with elements of diversification | 12–15 |
Venezuela | 72 (1950) | 15,893 | Raw materials (oil, hyper-raw materials, crisis) | 10–15 |
China | 38 (1984) | 23,309 | Diversified (industrial) | 2-3 |
Japan | 142 (1880) | 42,248 | Diversified (highly diversified, post-industrial) | 0.5-1 |
India | 71 (1951) | 8,379 | Diversified developing | 3-4 |
UAE | 52 (1970) | 55,368 | Transition from raw materials to diversified | 20–25 |
Saudi Arabia | 49 (1973) | 69,958 | Raw materials (oil and gas) in the early diversification stage | 25–30 |
Note to Table 2:
A high share of raw material exports in GDP (above ~10%) almost always indicates a raw materials type of economy.
GDP per capita PPP – gross domestic product per capita at purchasing power parity, a macroeconomic indicator reflecting the market value of all final goods and services produced over a specified period in all sectors of the economy on the territory of a particular state, regardless of the nationality of the factors of production used.
2.3. Analysis of the principle “man is the main value”
The first and key principle of economic humanization is the recognition of human capital as the main resource of modern society. "Investments in education, healthcare, culture, and social protection contribute to improvement of the population's standard of living, stimulate innovation, and ensure long-term economic growth," A. E. Kisova (a Russian political scientist and economist specializing in regional development, spatial analysis, and public administration) states in her dissertation [4].
For a more detailed examination of the given principle, Table 3 was formed, where expenditures on education and healthcare as a percentage of GDP were compared with the Human Development Index (HDI) as a key indicator. Data on economy type and time period since the beginning of the industrialization were also entered into the table to identify possible relationships with GDP per capita and the HDI.
Based on this table, the following conclusions can be drawn:
1. The most obvious and strong correlation can be traced between the level of investment in human capital (total expenditure on education and health care ), the value of the Human Development Index (HDI), and the value of GDP per capita:
- Countries in the group with the highest HDI values > 0.90 (Sweden, Norway, Germany, France, the United States, and Japan) have high GDP per capita values > $42,000 and high social spending > 14.7% of GDP. These are mature, post-industrial, diversified economies where wealth is generated by intellect and innovation – the products of creativity in the broadest sense of the word. To unleash creative potential, people need certain conditions: education, freedom of thought, access to information, the opportunity to experiment and make mistakes, health, and psychological well-being. The humanization of the economy that invests in healthcare, education, and a balanced, fulfilling life with minimal stress clearly creates more fertile ground for innovation.
- Countries in the group with average HDI values of 0.76–0.88 (Poland, Chile, Russia, and China) have average GDP per capita values and average social spending of approximately 10% of GDP. This group of countries is dominated by raw materials economies or developing diversified ones. Their investments in education and healthcare are a compromise between available revenues and spending priorities.
- Countries in the group with the lowest HDI values < 0.76 (Venezuela, India, Peru) have the lowest GDP per capita values < $15,000 and social spending < 10% of GDP. This likely creates a "poverty trap." Without investing in people, sustainable economic growth is impossible. The economies of these countries are either raw materials without effective governance or agro-industrial.
- Venezuela can be called an exception among the ranking's underperformers. Despite the lowest total public investment in education and healthcare (4.3%) among the entire sample, the HDI fails non-critically. This nonsense can be explained by the historical legacy of past investments (the economic boom following the discovery of large oil fields in the 1960s and the social programs supported by high oil revenues in the early 2000s), which is now rapidly eroding due to hyperinflation and the severe economic crisis that has developed since 2015. The HDI data presumably lags behind current reality and does not reflect the current collapse.
2. The influence of the duration of the period since the beginning of industrialization on the level of GDP per capita is traceable, but numerous exceptions have also been identified (see chart 1):
Most countries that began industrialization 100+ years ago (Germany, the United States, Sweden, France) have high GDP per capita ($55,000–76,000). These countries have consistently completed the entire transition from agrarian to industrial and post-industrial societies. This significant time resource allowed them to create developed infrastructures, production capacities, and a skilled workforce. This laid the foundation for the subsequent creation of deeply diversified and sustainable economies, independent of any single sector. Thus, a long period of industrialization allows for the creation of complex institutions and the accumulation of human capital, something that cannot be achieved in just a few decades.
- Norway is an exception among the leaders in the ranking based on the share of raw materials exports. It is the only country with a high share of raw materials exports that is considered a diversified economy. The secret lies in the prudent management of resources through a sovereign wealth fund that invests oil revenues in foreign assets, turning the "resource curse" into a "resource blessing." This deliberate policy has made it possible to avoid the negative consequences of the "resource curse."
- Russia (GDP approximately $35,000) is a clear example of a country with the "resource curse" in action among countries with "old" industrialization. Compared to Norway (GDP approximately $89,000), Russia has retained its dependence on raw materials and has a raw materials economy.
- A bloc of countries that began industrialization significantly later, < 80 years ago (Peru – 72 years, Venezuela – 72 years, India – 71 years), exhibits extremely low GDP per capita ($8,000–$16,000). These countries' economies are either raw materials or are just developing on the path to diversification.
- Nevertheless, a comparable group of countries whose industrialization began < 80 years ago (Poland – 72 years, China – 38 years, the UAE – 52 years, Saudi Arabia – 49 years) is demonstrating rapid, explosive growth, in some cases catching up with the GDP per capita of countries in the "old" industrialization group. This is a consequence of the "catch-up development" model. Poland, having carried out radical economic reforms, effectively took advantage of rapid integration into the European Union, a massive influx of foreign investment, and the experience of more developed economies. The UAE and Saudi Arabia effectively utilized modern oil and gas production technologies, bypassing the traditional stages of industrialization. China actively adopted the most modern technologies and a vast pool of cheap labor. The example of these countries suggests that effective governance and modern technologies can compensate for a short period of industrialization and significantly accelerate economic growth.
Conclusions:
- The presented data convincingly demonstrate that the level of economic development (GDP per capita), the type of economy (diversified vs. raw materials), and public policy priorities (education/healthcare expenditures) are determining factors for achieving a high HDI. The primary path to achieving a high HDI is high social spending based on high GDP per capita in the presence of a stable, post-industrial, diversified economy.
- High GDP per capita is important, but not sufficient. The quality of economic growth, the diversification of the economy, and how income is distributed and invested in society are far more important for a nation's well-being than its absolute value.
- Resource wealth can become a trap if strategic policies are not implemented to diversify the economy, invest in the future and in human capital.
Thus, the analysis clearly demonstrates that the most successful countries are those that invest in their people and, on that basis, create complex, diversified economies and products. It's worth noting that micro-examples of this policy include Google, Apple, and Yandex, which have long understood this connection. Their philosophy of organizing a workspace with maximum freedom and opportunities for collaboration, flexible schedules, and corporate culture is aimed at attracting and developing creative employees who will create the next breakthrough product. The growth of their market capitalization is a direct consequence of this policy.
Table 3
Total expenditure on education and health from GDP, Human Development Index (HDI) according to national statistical agencies, OECD, UNDP for 2022
Country | Total expenditure on education and health care from GDP, % | Human Development Index (HDI) | GDP per capita $ (2022) | Period since the beginning of industrialization, years | Type of economy |
Sweden | 17.7 | 0.947 | 62,926 | 132 | Diversified |
Norway | 17.0 | 0.966 | 89,114 | 117 | Diversified with the raw materials sector |
Germany | 17.3 | 0.951 | 63,150 | 151 | Diversified |
France | 17.7 | 0.910 | 55,493 | 174 | Diversified |
USA | 24.3 | 0.921 | 76,399 | 157 | Diversified |
Russia | 10.0 | 0.822 | 35,865 | 137 | Raw materials |
Poland | 11.5 | 0.881 | 45,343 | 72 | Diversified |
Peru | 9.4 | 0.762 | 15,893 | 72 | Raw materials |
Chile | 14.7 | 0.860 | 28,526 | 83 | Raw materials with elements of diversification |
Venezuela | 4.3 | 0.691 | 15,893 | 72 | Raw materials |
China | 10.0 | 0.788 | 23,309 | 38 | Diversified |
Japan | 14.8 | 0.936 | 42,248 | 142 | Diversified |
India | 6.7 | 0.644 | 8,379 | 71 | Diversified developing |
UAE | 8.8 | 0.937 | 55,368 | 52 | Transition from raw materials to diversified |
Saudi Arabia | 11.5 | 0.875 | 69,958 | 49 | Raw materials in the early stage of diversification |
Note to Table 3:
The Human Development Index (HDI) is a comprehensive indicator for assessing the quality of life in countries around the world. It reflects not only economic well-being (gross national income per capita) but also access to education, healthcare, and other basic opportunities for personal development (0.80-1.00 is very high, 0.7-0.799 is high, 0.550-0.699 is average, below 0.550 is low).
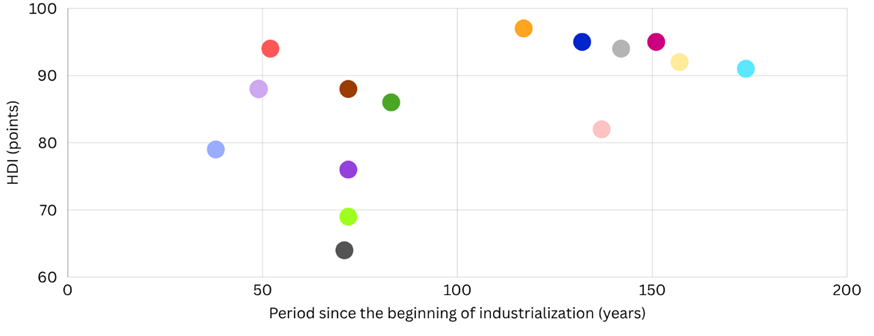
Fig. Period since the beginning of industrialization (years) and Human Development Index (HDI) (points) for a sample of countries
2.4. Analysis of the principle of "Social Justice"
Another important aspect of humanization of the economy is the fair distribution of wealth. This means reducing economic inequality through progressive taxation, establishing decent wages, and supporting vulnerable groups of the population. For example, A. E. Kisova and T. D. Romashchenko (Russian economists, authors of a number of articles and studies in labor economics and economic sociology) emphasize that "the Gini coefficient, which measures the level of income inequality, is significantly lower in countries with developed social policy (for example, in Norway) than in countries with a less equitable distribution of resources" [5, p. 110-115].
To substantiate the stated principle, Table 4 was formed, in which key indicators are examined in detail. In this case, the indicators were the poverty level and the social tension index.
What connections can be traced here:
- High income redistribution: European countries are democracies with diversified, developed economies. They exhibit low inequality, low poverty levels, and low or moderate social tension.
- Moderate income redistribution: The United States and Japan are democracies with diversified, developed economies. They exhibit high inequality, moderate poverty levels (higher than in the first group), and moderate social tension. In these countries, tension is partially offset by the high absolute income of part of the population.
- Low income redistribution: Russia, Chile, Peru, Venezuela are authoritarian regimes and democracies with raw materials economies. They demonstrate high inequality, high levels of poverty, and high social tension.
There are 4 countries (UAE, Saudi Arabia, China, and India) that are exceptions to the general system:
- The UAE and Saudi Arabia are countries with low tax redistribution but also extremely low poverty rates among their citizens. High resource revenues, through direct transfers and social benefits, help maintain low poverty. This ensures acceptable national stability.
- India, with its high Gini coefficient and extremely high poverty level, also falls out of the general logic and avoids maximum social tension due to its historically established caste system, which reduces the protest potential, and religious norms – Hinduism and Buddhism preach the acceptance of suffering in the current life for the sake of future reincarnations.
- In China, high inequality and poverty are partly offset by rapid welfare growth generally.
Thus, the data convincingly demonstrate that an active and effective state role in income redistribution through a progressive tax system and social spending is critical to reducing inequality and poverty, ensuring social stability, and decreasing social tension. A market economy, especially in a context of raw materials dependence, leads to the concentration of wealth in the hands of elites and increased social tension.
Table 4
Gini coefficient after taxes and minimum wage compared to the poverty level index at the international poverty line according to national statistical agencies (OECD Income Distribution Database, INSEE Fiscal Report, IRS Tax Statistics, INEI, and others), World Bank PovcalNet, Rosstat for 2022
Country | Gini coefficient after taxes | Redistribution index (RI), % | Minimum wage or actual minimum, US dollars | Poverty level according to the international poverty line ($3.65/day) | Social Unrest Index (SUI) |
Sweden | 0.27 | 42.5 | 1,800 | 0.1% | 2.3 |
Norway | 0.26 | 42.2 | 2,200 | 0.1% | 1.8 |
Germany | 0.29 | 42.0 | 1,985 | 0.4% | 3.1 |
France | 0.29 | 40.8 | 1,747 | 0.3% | 4.5 |
USA | 0.39 | 23.5 | 1,256 | 1.2% | 5.2 |
Russia | 0.41 | 10.9 | 242 | 2.7% | 7.6 |
Poland | 0.28 | 35.0 | 755 | 0.8% | 4.2 |
Peru | 0.44 | 15.4 | 282 | 8.5% | 8.0 |
Chile | 0.46 | 13.2 | 460 | 3.1% | 6.4 |
Venezuela | 0.50 | 5.0 | 20 | more than 25% | 9.2 |
China | 0.42 | 12.5 | 290–410 | 4.8% | 4.8 |
Japan | 0.32 | 25.0 | 1,150 | 0.7% | 2.5 |
India | 0.45 | 10.0 | 50–120 | 18.7% | 5.9 |
UAE | n/a low | n/a low | 500–700 | 0.1% | 2.0 |
Saudi Arabia | 0.40 | 15.0 | 960 | 0.1% | 4.5 |
Note to Table 4:
Ginni coefficient (Ginni index) evaluates income inequality (0 – complete equality, 1 – maximum inequality).
Redistribution Index (RI) reflects how effectively a country's tax system reduces income inequality between rich and poor citizens (a high index >30% means the tax system takes more from the rich and redistributes in favor of the poor; a low index <15% means a weak impact on inequality).
The Social Unrest Index (SUI) measures the risk of mass protests, strikes, dissatisfaction with the government, and economic vulnerability on a scale of 0 to 10 (0-3.99 low risk, 4-6.99 moderate risk, 7-10 high risk).
2.5. Analysis of the principle of “Caring for future generations as a guarantee of sustainable long-term development”
Caring for future generations is a necessary criterion for sustainable development and is another important principle of the humanization of the economy, which presupposes environmental responsibility through the introduction of “green” technologies and the transition to nuclear energy and, optimally, renewable energy sources, as causing less harm to the environment.
To examine this principle, Tables 5, 6, and 7 were formed, which summarize a variety of indicators that impact environmental performance in one direction or another: carbon footprint indicators, the share of renewable energy, the share of nuclear energy, the share of fossil fuel energy, electricity production and consumption per capita, the presence of a mandatory carbon credit system and the year the system was introduced, and the share of ESG funds in the total investment fund market. All these indicators were compared with the Economic Complexity Index (ECI) and Environmental Performance Index (EPI) of countries, as well as poverty levels, which also provide significant insights.
Analyzing the tables, the following key relationships can be identified:
1. Clear correlation between the Economic Complexity Index (ECI) and the Environmental Performance Index (EPI):
- High ECI, high EPI. Almost all countries with high-tech, non-raw materials economies (European countries and Japan) demonstrate successful results in reducing their carbon footprint and are also developing carbon credit systems. These countries produce high-value-added goods rather than raw materials, which requires fewer resources and energy per unit of GDP. Given their developed environmental culture (no accumulated air, water, and soil pollution, effective waste management), these countries have an average Environmental Performance Index (>50) but a high one compared to other countries.
- Low ECI, low EPI. Economies dependent on raw materials exports (Russia, Saudi Arabia, Venezuela, Peru) have low scores for both Economic Complexity and Environmental Performance. Extractive industries are among the most environmentally destructive.
2. The carbon footprint depends on both the energy consumption model and the level of development:
- Countries with a high share of renewable and nuclear energy (Sweden, France, Norway) have a low carbon footprint per capita despite high energy consumption.
- The main “polluters” are countries whose energy consumption is based on fossil fuels (UAE, Saudi Arabia, Russia).
- Low carbon footprints in developing economies (India, Peru, Venezuela) are largely due to poverty. A low carbon footprint here is a sign of poverty, not strong environmental policies. For example, India, despite its minimal carbon footprint and acceptable share of renewable energy, has an extremely low Environmental Performance Index. This paradox is explained by the low standard of living (approximately 240 million people in India lack access to electricity), low electricity consumption per capita (the average Indian consumes 10 times less electricity than an American and 3 times less than a Chinese), severe accumulated environmental problems (horrific air pollution in some regions, a water crisis – 80% of rivers are extremely polluted), unprofessional waste management (open dumps, burning trash on the streets), and the destruction of ecosystems (deforestation for the expansion of residential areas and farms).
3. The presence of a carbon pricing system is a sign of a mature environmental policy and a generally high level of economic and social development of the country:
- Countries with the highest EPI scores (Sweden, Norway, Germany, France, Poland) have long implemented carbon trading systems (ETS), which incentivize businesses to reduce emissions. A carbon credit system is a mechanism for transitioning from an economic model focused solely on profit to a humanized economic model that is not incompatible with economic success but makes environmental conservation an integral condition. Pollution becomes a direct expense for companies. This incentivizes companies to invest in green technologies, makes low-carbon business models more competitive, and directs financial flows through carbon trading to projects that reduce emissions (e.g., reforestation, renewable energy development). Combined with ESG investments, this creates a powerful signal to the market that generating profits while avoiding or minimizing social and environmental costs becomes financially beneficial.
- Most economies dependent on raw materials (the UAE, Saudi Arabia, Venezuela, and Russia) avoid carbon pricing systems as a threat to their raw materials model, demonstrating a belated introduction of carbon credit systems. This is due to their dependence on fossil fuel revenues.
4. The development of ESG mutual funds is also a sign of a mature environmental policy and a country's overall high level of economic and social development. The data demonstrates a clear correlation: the more developed and comprehensive a country's environmental policy, the more mature and significant the ESG investment market, and the higher the country's overall development indicators (ECI, EPI):
- Sweden, Norway, Germany, and France are leaders. These countries demonstrate a comprehensive and mature approach. They have a long-term strategy in which government regulation (the carbon tax was introduced about 20 years ago), economic interests (developed ESG funds account for 25–50% of all mutual funds), and technological development (high ECI > +1.15) work in concert to achieve sustainable development goals.
- The United States and Japan are highly economically developed countries (ECI > +1.6) and have strong market potential for a green transition. However, their political will and regulatory framework (carbon taxes have only been introduced in some regions) lag behind European leaders, which is reflected in their more modest ESG funds and EPI scores. The average EPI scores of these countries suggest that economic strength and innovation do not automatically translate into environmental leadership without equally strong and unified government policies.
- Other countries with diversified or transitional stable economies (Chile, Saudi Arabia, the UAE) are building green economy institutions by developing a system of ESG funds. These countries likely see this as an opportunity for modernization and attraction of responsible investment. Their ESG and EPI scores are directly linked to their environmental policy efforts.
- Developing countries with diverse economic types but extremely high poverty rates (Peru, India, Venezuela) exhibit a lack of carbon pricing systems, a low share of ESG funds, and an extremely low EPI. These countries often prioritize economic growth and poverty alleviation over environmental protection. The lack of developed ESG funds and comprehensive environmental policies reflects these objective priorities and resource constraints.
A clear exception in the entire system of indicators in the tables is China. While its carbon footprint (8.0 vs. 8.6) and energy share (fossil fuel energy share 65.6 vs. 71.8) are comparable to those of, for example, Japan, it has a critically low EPI (28.4 vs. 57.2), which again forces us to turn to the history of economic development of these countries. The low EPI, considered in this study, in conjunction with other indicators at a specific point in time (as of the end of 2022), is the result of long-term environmental and economic policies. It is also worth noting that China has been a global leader in air and soil pollution for decades, and only relatively recently has it addressed its acute environmental problems.
Thus, the EPI is a fairly reliable and objective indicator. It clearly demonstrates that environmental performance is the result of a complex, diversified economy with a high ECI, clean energy, and mature institutions (the presence of ETS and ESG funds). Wealth based on raw materials sales does not lead to a high EPI; it merely increases the carbon footprint, creating the illusion of prosperity at the expense of future generations. Sustainable development requires significant effort and investment in environmental technologies. Countries that neglect the environment face environmental challenges and risks for future generations.
Table 5
Carbon footprint per capita (tonnes CO₂), shares of renewable, nuclear, and fossil fuel energy according to the International Energy Agency (IEA), BP p.l.c., Ember, national energy reports, Global Carbon Atlas, Eurostat, IRENA, EIA, Yale EPI Report for 2022
Country | Carbon footprint, tons of CO2 per capita | Share of renewable energy, % | Share of nuclear energy, % | Share of energy from fossil fuels, % |
Sweden | 3.4 | 63.4 | 30.1 | 6.5 |
Norway | 6.2 | 75.4 | 0.0 | 24.6 |
Germany | 7.9 | 46.3 | 5.8 | 47.9 |
France | 4.3 | 19.3 | 69.0 | 11.7 |
USA | 13.7 | 21.5 | 18.2 | 60.3 |
Russia | 11.4 | 17.4 | 20.0 | 62.6 |
Poland | 7.9 | 17.5 | 0.0 | 82.5 |
Peru | 1.8 | 53.5 | 0.0 | 46.5 |
Chile | 4.5 | 32.2 | 0.0 | 67.8 |
Venezuela | 5.3 | 28.9 | 0.0 | 71.1 |
China | 8.0 | 29.4 | 5.0 | 65.6 |
Japan | 8.6 | 21.0 | 7.2 | 71.8 |
India | 1.9 | 38.5 | 1.5 | 60.0 |
UAE | 21.8 | 0.6 | 0.0 | 99.4 |
Saudi Arabia | 18.0 | 0.1 | 0.0 | 99.9 |
Table 6
Electricity production and consumption per capita according to the International Energy Agency (IEA), Ember, and national energy reports for 2022
Country | Poverty level according to the international poverty line ($3.65/day) | Electricity production per capita, kWh/person | Electricity consumption per capita, kWh/person |
Sweden | 0.1% | 25,000 | 12,500 |
Norway | 0.1% | 30,500 | 22,900 |
Germany | 0.4% | 6,800 | 6,500 |
France | 0.3% | 7,200 | 6,900 |
USA | 1.2% | 12,800 | 12,000 |
Russia | 2.7% | 7,500 | 6,700 |
Poland | 0.8% | 5,600 | 5,400 |
Peru | 8.5% | 1,600 | 1,400 |
Chile | 3.1% | 3,900 | 3,700 |
Venezuela | more than 25% | 2,200 | 1,800 |
China | 4.8% | 5,900 | 5,500 |
Japan | 0.7% | 7,400 | 7,100 |
India | 18.7% | 1,300 | 1,100 |
UAE | 0.1% | 13,500 | 12,800 |
Saudi Arabia | 0.1% | 10,200 | 9,500 |
Table 7
Presence of a carbon credit system and the year of its launch, the share of ESG funds in the investment fund market, Economic Complexity and Environmental Performance Indexes based on the Yale EPI Report, Morningstar, GSIA, and national association reports for 2022
Country | Presence of a carbon credit system or equivalent | Year of launch of carbon credit system or equivalent | Share of ESG funds in the investment fund market, % | Economic Complexity Index (ECI) | Environmental Performance Index (EPI) |
Sweden | Yes | 2002 | 45–50 | +1.82 | 72.7 |
Norway | Yes | 2005 | 30–40 | +1.15 | 77.7 |
Germany | Yes | 2005 | 25–35 | +1.94 | 62.8 |
France | Yes | 2005 | 35–45 | +1.45 | 71.1 |
USA | partially (at the level of individual states) | 2009 | 15–20 | +1.60 | 51.1 |
Russia | partially (experimental mode in one area) | 2022 | < 1 | -0.42 | 42.5 |
Poland | Yes | 2005 | 5–10 | +0.85 | 60.9 |
Peru | No | - | < 2 | -0.55 | 57.3 |
Chile | Yes | 2017 | 5–10 | +0.10 | 55.3 |
Venezuela | No | - | < 0.5 | -1.20 | 43.0 |
China | Yes | 2021 | 2–5 | +0.95 | 28.4 |
Japan | partially (in certain regions) | 2010 | 10–15 | +1.90 | 57.2 |
India | No | - | 3–7 | -0.30 | 18.9 |
UAE | No | - | 5–15 | +0.10 | 45.9 |
Saudi Arabia | No | - | 5–15 | -0.45 | 42.4 |
Note to Table 7:
ESG mutual funds channel money from private investors into companies that demonstrate best practices in environmental protection (E), social responsibility (S), and corporate governance (G). ESG mutual funds are changing the investing paradigm. The question is no longer, "How much do I earn?" but, "What value do I create and how do I earn?". Profitability is becoming dependent on a company's ability to make a positive impact beyond its direct financial statements. Through these funds, capital becomes more accessible to companies that meet ESG criteria.
The Economic Complexity Index (ECI) measures the diversification and technological sophistication of a country's exports. The scale ranges from negative values (raw materials economies) to +2.5 (high-tech countries). The index is calculated based on an analysis of thousands of export items, revealing the uniqueness and complexity of the goods produced.
The Environmental Performance Index (EPI) is a global ranking that evaluates countries' environmental policies in two key areas: ecosystem health (biodiversity, forests, and water resources) and public health (air and water quality, exposure to toxins). The index scale is: 90–100 (leaders), 80–89 (high level), 70–79 (average level), 60–69 (below average), and <60 (low level).
2.6. Analysis of the principle of "Ethics in business and democratization of labor"
The final important element of the humanization of the economy is the democratization of labor through the participation of workers in enterprise management. The development of cooperatives, social entrepreneurship, and other forms of social economy contributes to the strengthening of social and economic stability due to less dependence on the state budget, participation in management and distribution of income between members, stability and improvement of the quality of labor, and, in part, environmental responsibility (most social enterprises operate in the "green economy"). These organizations prioritize social and environmental goals above profit, reinvest in social and environmental missions, and employ vulnerable groups of the population.
An analysis of the data in Table 8 below demonstrates that the share of social economy in GDP and the sustainability index of social enterprises correlate with the Social Progress Index (SPI). Countries with a share of social economy enterprises >8% of GDP (Sweden, Norway, Germany, France) and a high level of their sustainability are leaders in SPI.
However, it's also worth noting that government policy can either enhance or weaken the effect. Thus, even 3.8% of the social economy in Chile yields an SPI of 82.9, which is explained by large-scale social programs.
Table 8
Share of social economy in GDP, sustainability index of social enterprises and social progress index according to OECD, ILO, Common Good Economy Network, Social Progress Imperative, and other national reports for 2022
Country | Share of social economy (cooperatives, social entrepreneurship and other forms) in GDP, % | Social Economy Resilience Index (SERI) | Social Progress Index (SPI) |
Sweden | 9.8 | 82 | 90.4 |
Norway | 8.7 | 80 | 90.3 |
Germany | 8.3 | 78 | 88.8 |
France | 9.5 | 81 | 87.4 |
USA | 5.9 | 65 | 84.2 |
Russia | 1.7 | 48 | 69.1 |
Poland | 6.2 | 68 | 85.1 |
Peru | 3.1 | 53 | 71.6 |
Chile | 3.8 | 62 | 82.9 |
Venezuela | 2.3 | 45 | 63.8 |
China | 4.3 | 58 | 72.0 |
Japan | 5.8 | 72 | 87.9 |
India | 4.1 | 51 | 60.2 |
UAE | 3.5 | 61 | 78.4 |
Saudi Arabia | 2.9 | 55 | 70.2 |
Note to Table 8:
Scale of the share of social economy in GDP: 10%+ high level, 5–10% average level, <5% low level.
Social Economy Resilience Index (SERI) assesses the ability of social economy organizations to withstand crises and maintain socio-economic stability. Its scale is: 80–100 (exceptional resilience), 60–79 (high resilience), 40–59 (average resilience), and <40 (low resilience).
The Social Progress Index (SPI) is a comprehensive indicator that assesses the actual quality of life in a country, going beyond economic metrics (such as GDP). Its scale is: ≥85 very high progress, 70–84 high, 55–69 average, and <55 low.
2.7. Analysis of barriers and obstacles to the implementation of the principles of humanization of the economy
Analyzing Table 9, which displays indicators reflecting barriers to the humanization of the economy (resource dependence, corruption, and bureaucracy), it can be noted that there is a correlation between a high share of raw material exports (>60%) and a low EC1 (respectively, a purely raw materials type of economy) and a low CPI (corruption perception index). The leaders in the ranking of countries with high public sector corruption are outsiders in the economic complexity index: Venezuela, with a 98% share of raw material exports; Russia, with 70%; and Peru, with 75%. These countries, with a high share of raw material exports, have completely undiversified economies, meaning they have no sources of income other than the sale of raw materials. The high level of public corruption in these countries is due, among other things, to the concentration of raw materials–the main sources of state revenue-in the hands of the country's elites, which leads to increased corruption (the "resource curse").
A correlation is also found between government type, the Corruption Perceptions Index, and the Economic Complexity Index. Overall, an analysis of 2022 data reveals a correlation: countries with developed democracies have higher CPI than countries with less established democracies or authoritarian or hybrid regimes. This is linked to the quality of institutions, freedom of enterprise, and, consequently, the dynamics of economic growth, the level of investment in economic development and in innovation.
Once again, it's impossible not to mention the exceptions to the identified system: the UAE and Saudi Arabia, which, despite their authoritarian regimes, raw materials economies, and high share of raw materials exports, have decent Corruption Perceptions Index scores comparable to those of the United States. It's worth noting that the governments of the UAE and Saudi Arabia are pursuing policies to modernize their economies. To diversify their economies, attract foreign investment, and create global business hubs, they needed an impeccable reputation for business practices. To this end, they created the most comfortable and transparent conditions for business: free economic zones with transparent laws and courts, clearly defined procedures, and control of their compliance. They also introduced digitalization of public services, significantly reducing the potential for corruption. All these processes are reflected in the Economic Complexity Index and Corruption Perceptions Index, significantly improving these indicators.
Norway and Chile are also notable exceptions: despite their high share of raw materials exports, they have high Corruption Perceptions Indexes and decent Economic Complexity Indexes. While the UAE and Saudi Arabia's high CPI scores are a consequence of authoritarian stability and vertical control, in Norway and Chile, it is the result of the long-term development of strong democratic institutions.
Table 9
Corruption Perception Index, Economic Complexity Index, share of raw materials exports in country’s exports, share of raw materials exports in GDP according to Transparency International, World Bank, Harvard Atlas of Economic Complexity, and The Economist Democracy Index for 2022
Country | Share of raw materials exports in country’s exports, % | Share of raw materials exports in GDP, % | Economic Complexity Index (ECI) | Corruption Perceptions Index (CPI) |
Sweden | 35 | 5–7 | +1.82 | 85 |
Norway | 65 | 15 | +1.15 | 84 |
Germany | 20 | 2-3 | +1.94 | 80 |
France | 25 | 1-2 | +1.45 | 72 |
USA | 30 | 2-3 | +1.60 | 69 |
Russia | 70 | 15–20 | -0.42 | 28 |
Poland | 30 | 5–7 | +0.85 | 58 |
Peru | 75 | 10 | -0.55 | 38 |
Chile | 80 | 12–15 | +0.10 | 67 |
Venezuela | 98 | 10–15 | -1.20 | 14 |
China | 15 | 2-3 | +0.95 | 45 |
Japan | 5 | 0.5–1 | +1.90 | 73 |
India | 40 | 3-4 | -0.30 | 40 |
UAE | 85 | 20–25 | +0.10 | 67 |
Saudi Arabia | 90 | 25–30 | -0.45 | 52 |
Notes to Table 9:
The Economic Complexity Index (ECI) measures the diversification and technological sophistication of a country's exports. The scale ranges from negative values (raw materials economies) to +2.5 (high-tech countries). The index is calculated based on an analysis of thousands of export items, revealing the uniqueness and complexity of the goods produced.
The Corruption Perceptions Index (CPI) reflects the level of corruption in the public sector on a scale from 0 (the most corrupt country) to 100 (the least corrupt). It is based on expert assessments and surveys of entrepreneurs, analyzing areas such as bribery, misappropriation of public funds, patronage in government appointments, and the effectiveness of anti-corruption measures.
Critically, these indices are interrelated: corruption (as measured by the CPI) often hinders the development of a complex economy (ECI).
3. Discussion of the obtained results and formulation of the main conclusions of the study
Based on the analysis, it can be concluded that the successful experiences of a number of countries demonstrate the viability of the concept of humanization of the economy. Germany and the Scandinavian countries demonstrate a successful combination of a market economy with a strong social policy and other criteria of economic humanization principles.
Table 10
Examples of successful implementation of the principles of humanization of the economy
Country | Implemented principles of humanization of the economy |
Sweden, Norway, Germany |
|
Based on the conducted analysis and historical context, two clear paths can be identified that were chosen by the most successful and developed countries among those analyzed:
- Socially oriented market economy (humanized economy model): characterized by an active role of the state in income redistribution, the creation of a strong social protection system (healthcare, education, pensions), and an aspiration to reduce inequality and build a "welfare society." Notable examples include Sweden, Norway, and Germany.
- Liberal market economy: the primary emphasis is on the free market, minimal government intervention in the economy, low taxes, and the encouragement of individual entrepreneurship. Social security is largely an individual responsibility or is provided through the market. Prominent examples include the United States and Japan. Japan, despite cultural differences, adopted many features of this model economically after World War II, particularly in corporate governance and the role of big business.
Below is a comparative analysis of these groups in the following context: Scandinavian countries (Sweden, Norway) versus the USA and Japan versus Germany.
Group 1: Scandinavian countries (Sweden, Norway) vs. the USA.
Key similarities:
- All countries have diversified economies and very high levels of GDP per capita ($62,926 – $89,114).
- High human development indices (>0.92) that indicate a high quality of life in general.
- Long history of stable political structure and industrialization (>100 years).
Key differences:
1. Redistribution of wealth and inequality:
- Scandinavian countries exhibit exceptionally low Gini coefficients (0.26–27) and a near-zero poverty rate (0.10%). This is a direct consequence of humanization policies. A progressive tax system and high social spending effectively redistribute wealth.
- Despite a comparably high GDP per capita in the group ($76,399), the United States has the highest Gini coefficient (0.39) in the group and a poverty rate (1.20%) that is 12 times higher than in Scandinavia. This confirms the thesis that the liberal model creates greater inequality, even with high overall prosperity.
2. The role of the state and social spending:
- Paradoxically, the US spends a whopping 24.3% of GDP on education and healthcare (the highest figure among all countries in the sample), yet the results are clearly worse. This is explained by the fact that spending in the US is largely private (expensive health insurance, fee-based higher education). The system is inefficient in terms of "social impact per dollar."
- Scandinavia spends less (17.0–7% of GDP), but the services are public and of high quality, ensuring universal access. This is a more effective model in terms of humanization.
- Quality of society and environment:
- Scandinavian countries lead in the Social Progress Index (90.3–4) and the Environmental Performance Index (72.7–77.7). This reflects a comprehensive approach to development, where economic growth is inseparable from social and environmental well-being.
- The United States lags behind on these indicators (SPI=84.2, EPI=51.1), indicating that economic efficiency is prioritized over social and environmental components.
3. Corruption:
- The more cohesive and equal societies of Scandinavia show the highest scores on the Corruption Perceptions Index (84–85 points).
- The United States (69 points) shows the worst result in the group of developed democracies, which correlates with the characteristic of the type of political regime indicated in the table: “fusion of business and government” (lobbying).
Conclusion for Group 1: The Scandinavian model of humanization of the economy has proven effective in creating a more equal, socially secure, and sustainable society with a high quality of life. The liberal US model generates comparable enormous economic wealth, but at the cost of significant inequality and lower social and environmental standards.
Group 2: Germany vs. Japan (considering post-war recovery).
This comparison is particularly revealing in the historical context, as both countries:
- Were completely destroyed in 1945 after the end of World War II (both countries took a major part in the war and lost).
- Have a comparable period since the beginning of industrialization (Germany – 151 years, Japan – 142 years).
- They have equal length of existence of the current democratic regime (75 years).
- They have highly diversified and complex economies (high ECI: 1.94 and 1.90).
Key differences:
1. Selecting an economic model:
- Germany consciously chose the path of a socially oriented market economy (a concept pioneered by Ludwig Erhard, the eminent economist and statesman, which became the foundation of Germany's post-war economic recovery). Erhard believed that economic freedom was a necessary condition for political freedom, and the state's social responsibility was a guarantee of societal stability. His approach can be characterized as a "third way" between wild capitalism and totalitarian socialism. It is a humanizing approach aimed at combining market competition with a strong social network.
- Japan followed a path similar to the American one, with an emphasis on powerful corporations, lifetime employment, and a relatively weak state social security system compared to Europe. Social security was largely provided by companies and families.
2. Results of model selection:
- Inequality: Germany (Gini coefficient of 0.29) demonstrates a more equal income distribution than Japan (0.32). The poverty rate in Japan (0.70%) is almost twice as high as in Germany (0.40%).
- Social spending: Germany spends 17.3% of GDP on social benefits (education and healthcare), close to the Scandinavian level. Japan spends significantly less (14.8%). This directly reflects the varying roles of the state in societal well-being.
- Quality of life and society: Germany has a higher HDI (0.951 vs. 0.936) and SPI (88.8 vs. 87.9), indicating a higher overall quality of the social environment.
- Economic impact: Despite all this, Germany's per capita GDP ($63,150) is significantly higher than Japan's ($42,248). This may indicate that the German model has proven not only more "humane" in the long term, but also more economically efficient in today's environment.
Conclusion for Group 2: Both countries achieved an "economic miracle" after the end of World War II. However, Germany's choice of a humanizing path (social market economy) led to the creation of a society with less inequality, a stronger system of state social support, and, notably, a higher level of economic well-being per capita today. The Japanese model, closer to the American one, led to the formation of a society with greater social stratification.
General conclusion:
The analysis convincingly demonstrates that the humanization model of the economy (a socially oriented market economy) leads to the formation of more balanced, just, and socially sustainable societies without compromising economic competitiveness. Countries that have chosen this path (Scandinavian countries) lead in indicators of equality, social progress, and the fight against poverty and corruption.
The liberal-individualist model (USA/Japan), although capable of generating high aggregate GDP, creates significant inequality and leaves issues of social security to the market or corporations, which ultimately results in lower comprehensive indices of the quality of society (SPI, HDI) and higher levels of poverty.
The historical context of the post-war recovery of Germany and Japan makes their comparison a particularly pure experiment, which demonstrates the advantages of a socially oriented path even under conditions of identical starting opportunities.
Thus, in answering the first two questions posed, "Are there any examples in the world of countries with a humanized economy?" and "Is the humanization of the economy compatible with the further effective growth of the country's economy?", a positive answer can be given, supported by the research conducted.
Another conclusion that can be drawn from the study: humanization is a benefit that can only be afforded by countries with stable political regimes that have already resolved the basic problems of survival and economic growth. An analysis of all the research tables shows that such countries must meet the following thresholds in the designated categories:
1. High economic performance:
- GDP per capita > $40,000. This is the level at which society as a whole overcomes poverty and a significant middle class is formed, willing to pay taxes in exchange for high-quality public goods.
- A diversified, complex economy (high ECI > 1.0). A raw materials economy (Russia, Venezuela, Saudi Arabia) does not create a stable, broad tax base (revenues depend on resource prices) and often leads to the formation of authoritarian or oligarchic regimes, where there is no incentive to share wealth. A diversified, knowledge- and technology-based economy (characteristic of all countries with a humanized economy) requires a highly educated and healthy workforce, which creates a natural demand for investment in human capital.
- Overcoming absolute poverty (<1%). While a significant portion of the population lives in poverty, state resources are directed toward targeted assistance rather than creating a universal system of high-quality services.
2. Stability and democracy of political institutions:
- The key factor is the long-term stability of political institutions. Economic development alone is not enough. A political system capable of transforming economic success into sustainable social institutions is needed.
- Countries with humanized economies (Sweden, Norway, Germany) have stable democratic regimes for over 65–75 years. It is not a coincidence. It is over a long period that a social agreement between citizens, businesses, and the state is formed. People trust the state because they believe their taxes won't be stolen but will be converted into high-quality public services. This trust is reflected in high Corruption Perceptions Indexes (CPI > 80).
- Chile and Poland are examples of stable democracies (35 years) that have reached the GDP threshold and are already demonstrating significant social progress (SPI > 82–85) compared to their less stable neighbors (Peru, Venezuela). They may be in a transitional phase toward humanization of the economy.
- Russia, China, and Venezuela demonstrate that even with significant economic indicators (Russia with $35,000 GDP per capita, China with rapid growth), authoritarian regimes do not choose the path of systemic humanization. Social spending in these countries is low (10% of GDP), and inequality is high. The state in such systems is not accountable to the population and has no incentive to ensure fair redistribution.
General conclusion:
The analysis shows that time for development is a resource, but not a guarantee of success. Humanization of the economy becomes possible not at a specific year of industrialization, but when two conditions are simultaneously met:
- Economic condition: The country has achieved a high level of prosperity (GDP per capita > $40,000 – $50,000) based on a diversified, complex economy that creates a material basis for redistribution.
- Political condition: the country has had stable, publicly accountable democratic institutions for a long time (as in the case of Poland, which may choose a socially oriented market economy model, for at least 35 years), which form public demand for justice and ensure the efficient and transparent use of resources for social purposes.
Thus, in answer to the last question posed, "At what stage of the country's political and economic development does economic humanization become possible as a branch of further development?", it can be answered that economic humanization is a conscious, but not obligatory, political choice of a mature democratic society that has achieved a high level of economic development.
4. Conclusion
The study analyzed the key principles of humanization of the economy (recognition of human capital as the main resource of modern society, social justice, concern for future generations through ecology, ethics in business and democratization of labor), identified the main barriers and obstacles to its implementation (raw materials dependence, corruption, bureaucracy), and found answers to the questions posed in the study:
- Are there any examples in the world of countries with a humanized economy?
- Is the humanization of the economy compatible with the further effective growth of the country's economy, or is it a factor hindering economic development?
- At what stage of a country's political and economic development does economic humanization become possible?
The study identified countries that have chosen the path of economic humanization, embodied in the construction of a socially oriented market economy. These countries include Sweden, Norway, and Germany.
These countries lead in economic indicators (GDP per capita, Economic Complexity Index) as well as in equality, social progress, poverty and corruption reduction, and environmental efficiency. The analysis convincingly demonstrates that the humanization model of the economy leads to the formation of more balanced, just, and socially sustainable societies without compromising economic competitiveness.
Therefore, humanization of the economy is not a utopian, unrealistic concept. However, as the study also confirmed, only countries with stable political regimes that have already resolved the basic problems of survival and economic growth can afford this development path.
At the same time, the long period allocated for the development of the country's economic and political systems is a resource, but it is not a guarantee of success. Humanization of the economy becomes possible not at a specific year after the country's industrialization begins, but rather when two conditions are simultaneously met: the country achieves a high level of prosperity (GDP per capita > $40,000 - $50,000) based on a post-industrial, diversified, high-tech economy; and the existence of stable, publicly accountable democratic institutions over a long period (at least 35 years), which generate public demand for justice and ensure the effective and transparent use of resources for social purposes.
Thus, the humanization of the economy is a conscious, but not obligatory, political choice of a mature democratic society that has achieved a high level of economic development.
