
1. Introduction
The energy industry underpins national economic security and industrial development. Its long-lived fixed assets and long construction cycles make energy enterprises heavily dependent on external financing, so their capital structure is typically more leveraged than that of firms in most other industries.
Since China announced its goals of peaking carbon emissions before 2030 and achieving carbon neutrality before 2060, energy enterprises have faced a twofold financing challenge. Fossil-energy firms must finance environmental upgrades while their assets risk becoming stranded, and renewable firms must fund rapid capacity expansion. Whether debt financing enhances or erodes performance has become a practical question for managers, investors, and regulators alike.
Classical capital structure theory provides competing predictions. The trade-off theory implies an optimal debt level, whereas the pecking order theory predicts a negative association between leverage and profitability. Empirical evidence for the energy sector, which combines high asset tangibility with strong state involvement, remains limited. This study addresses this gap by examining the nonlinear effect of capital structure on the performance of Chinese listed energy enterprises and by testing whether this effect differs by ownership type and energy sub-sector.
2. Literature Review and Hypotheses
2.1. Capital Structure Theories
Modigliani and Miller [1, p. 261-297] showed that, in a frictionless market, firm value is independent of capital structure. Once corporate taxes are introduced, the tax deductibility of interest makes debt valuable [2, p. 433-443]. The trade-off theory weighs these tax benefits against distress costs, and agency theory adds that debt disciplines managers by reducing free cash flow [3, p. 305-360; 4, p. 323-329] while creating shareholder–creditor conflicts. By contrast, the pecking order theory holds that information asymmetry leads firms to prefer internal funds, then debt, then equity [5, 9. 575-592; 6, p. 187-221].
2.2. Empirical Evidence on Leverage and Performance
Empirical findings are mixed. Several studies report a negative relationship between leverage and profitability, consistent with the pecking order view [7, p. 1-19; 8, p. 1421-1460]. Others find that leverage improves profit efficiency up to a certain point, after which the effect reverses [9, p. 1065-1102; 10, p. 621-632]. For energy enterprises, high asset tangibility increases debt capacity, yet price volatility in fuel and electricity markets and policy uncertainty increase the probability of financial distress.
2.3. Research Hypotheses
As shown in figure, debt affects performance through positive channels (tax shields and the disciplinary effect on free cash flow) and negative channels (distress costs and underinvestment). At low leverage, the positive channels dominate; beyond a certain point, the negative channels prevail.
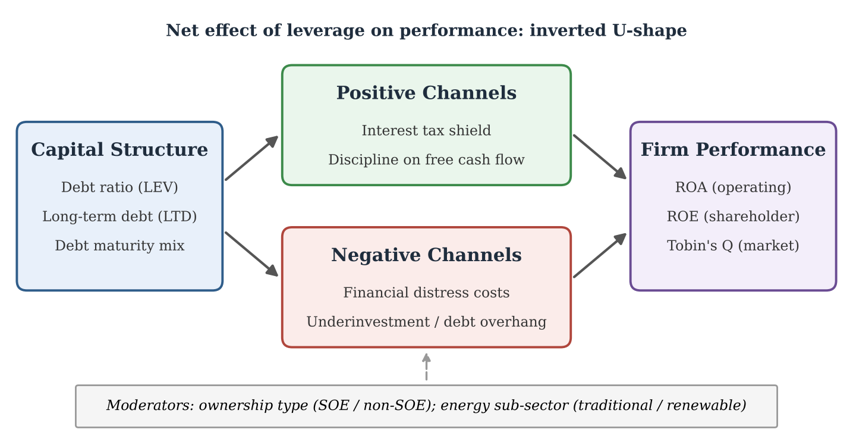
Fig. Conceptual Framework of the Study
H1: There is an inverted U-shaped relationship between the debt ratio and the performance of energy enterprises.
H2: The negative effect of high leverage is weaker for state-owned enterprises (SOEs), owing to soft budget constraints and implicit government guarantees.
H3: The effect of capital structure differs between traditional fossil-energy and renewable energy enterprises.
3. Research Design
3.1. Sample and Data
The initial sample consists of A-share companies classified under the energy-related industries (coal, oil and gas, electricity and heat production, and new energy) of the China Securities Regulatory Commission industry classification from 2014 to 2023. Firms under special treatment (ST/*ST), firms with negative equity, and observations with missing key variables are excluded. The final sample contains 168 firms and 1,512 firm-year observations. Financial data are drawn from the CSMAR and Wind databases, and continuous variables are winsorized at the 1st and 99th percentiles to mitigate the influence of outliers.
3.2. Variables and Model
Firm performance is measured by ROA (net profit divided by total assets), with ROE and Tobin’s Q used as alternative accounting and market-based measures. Capital structure is measured by the debt-to-asset ratio (LEV) and the long-term debt ratio (LTD, long-term liabilities divided by total assets). Control variables include firm size (SIZE, natural logarithm of total assets), revenue growth (GROWTH), asset tangibility (TANG, fixed assets divided by total assets), and ownership type (SOE, equal to 1 for state-controlled firms). The baseline model is specified as follows:
Perfit = β0 + β1LEVit + β2LEV2it + β3LTDit + γControlsit + μi + λt + εit, (1)
Where μᵢ and λₜ denote firm and year fixed effects. An inverted U-shape requires β₁ > 0 and β₂ < 0, with the turning point located at LEV* = −β₁ / (2β₂). Standard errors are clustered at the firm level.
Table 1
Descriptive Statistics of Main Variables (N = 1,512)
Variable | Mean | Std. Dev. | Min | Median | Max |
ROA | 0.036 | 0.049 | −0.172 | 0.032 | 0.198 |
ROE | 0.068 | 0.114 | −0.486 | 0.071 | 0.352 |
Tobin’s Q | 1.47 | 0.79 | 0.72 | 1.22 | 5.64 |
LEV | 0.562 | 0.168 | 0.118 | 0.581 | 0.912 |
LTD | 0.281 | 0.139 | 0.006 | 0.274 | 0.648 |
SIZE | 23.71 | 1.39 | 20.36 | 23.58 | 27.94 |
GROWTH | 0.108 | 0.263 | −0.452 | 0.071 | 1.386 |
TANG | 0.471 | 0.181 | 0.042 | 0.489 | 0.857 |
SOE | 0.63 | 0.48 | 0 | 1 | 1 |
Table 1 reports the descriptive statistics. The mean debt ratio is 56.2%, and the 75th percentile exceeds 68%, confirming the heavy debt burden of the sector. The mean ROA is only 3.6%, and fixed assets account for about 47% of total assets, reflecting the capital-intensive nature of the sector.
4. Empirical Results
4.1. Baseline Regression
Column (1) of Table 2 shows that, in the linear specification, the debt ratio is negatively associated with ROA at the 1% level: a 10-percentage-point increase in LEV reduces ROA by about 0.58 percentage points. After adding the squared term in column (2), the coefficient on LEV becomes positive and the coefficient on LEV² is significantly negative, implying an inverted U-shaped relationship with a turning point at a debt ratio of 47.4%. Columns (3) and (4) yield the same pattern for ROE and Tobin’s Q, with turning points of 47.3% and 38.1%, respectively. H1 is therefore supported.
Table 2
Fixed-Effects Regression Results
Variable | (1) ROA | (2) ROA | (3) ROE | (4) Tobin’s Q |
LEV | −0.058*** (−6.12) | 0.146** (2.31) | 0.398** (2.18) | 1.072* (1.79) |
LEV² |
| −0.154*** (−2.87) | −0.421*** (−2.64) | −1.405** (−2.26) |
LTD | 0.027** (2.09) | 0.025** (2.02) | 0.041* (1.71) | 0.338** (2.15) |
SIZE | 0.006*** | 0.006*** | 0.014*** | −0.187*** |
GROWTH | 0.021*** | 0.021*** | 0.052*** | 0.214*** |
TANG | −0.019* | −0.018* | −0.036 | −0.402** |
SOE | −0.004 | −0.004 | −0.009 | −0.121 |
Firm / Year FE | Yes | Yes | Yes | Yes |
Turning point | — | 0.474 | 0.473 | 0.381 |
Within R² | 0.214 | 0.229 | 0.187 | 0.163 |
Observations | 1,512 | 1,512 | 1,512 | 1,512 |
Note: t-statistics based on firm-clustered standard errors in parentheses; ***, **, and * denote significance at the 1%, 5%, and 10% levels.
With the sample mean (56.2%) beyond the turning point, the typical energy enterprise is over-leveraged. The positive coefficient on LTD shows that long-term financing, which matches the long payback of energy assets, improves performance.
4.2. Heterogeneity Analysis
Table 3
Effect of Leverage on ROA by Ownership and Energy Sub-sector
Variable | SOE | Non-SOE | Traditional energy | Renewable energy |
LEV | −0.041*** (−3.96) | −0.087*** (−5.48) | −0.071*** (−5.92) | −0.036** (−2.24) |
LTD | 0.019 (1.32) | 0.034** (2.07) | 0.012 (0.88) | 0.048*** (2.71) |
Controls / FE | Yes | Yes | Yes | Yes |
Observations | 953 | 559 | 874 | 638 |
Table 3 reports the split-sample results. The adverse effect of leverage on ROA for non-SOEs (−0.087) is more than twice that for SOEs (−0.041), and the difference is significant based on a Chow test (p < 0.05). This supports H2: implicit government guarantees lower the expected distress costs of state-owned energy firms.
Traditional fossil-energy firms also suffer more from high leverage than renewable energy firms. Coal and thermal power companies face declining demand and fuel price shocks, which raise the cost of debt overhang. In renewable firms, long-term debt significantly raises ROA, as long-term project finance matches stable contract-based revenues. H3 is supported.
4.3. Robustness Checks
Replacing LEV with the interest-bearing debt ratio yields a similar inverted U-shape (turning point 0.45), and lagging all explanatory variables by one year leaves the key coefficients unchanged. A panel threshold model following Hansen [11, p. 345-368] identifies a single threshold at a debt ratio of 0.49, above which leverage significantly reduces ROA.
5. Discussion
The results reconcile competing theories: the negative linear coefficient echoes the pecking order view [7, p. 1-19; 8, p. 1421-1460], but the quadratic specification shows that it reflects mainly over-leveraged firms, while below the optimum debt still adds value through tax shields and managerial discipline [3, p. 305-360; 9, p. 1065-1102; 10, p. 621-632].
The gap between the estimated optimum (about 47%) and the observed average (about 56%) has clear practical implications. Many energy enterprises carry more debt than is optimal, often owing to policy-driven investment and easy bank credit. The differences across ownership and sub-sectors indicate that a uniform deleveraging target is not appropriate: private and fossil-energy firms should reduce leverage more urgently, while renewable firms can benefit from extending debt maturity rather than simply cutting debt.
6. Conclusion
Using panel data on 168 Chinese listed energy enterprises from 2014 to 2023, this study finds an inverted U-shaped relationship between capital structure and performance, peaking at a debt ratio of roughly 47%, well below the sample average. The adverse effect of excessive leverage is stronger for non-state-owned and traditional fossil-energy enterprises, and a higher proportion of long-term debt improves performance, especially in renewable energy firms.
Two recommendations follow. First, energy enterprises should set target debt ratios within a moderate range and reduce leverage gradually through equity financing, asset securitization, and the disposal of inefficient assets. Second, firms should optimize debt maturity by using long-term instruments such as green bonds and project finance to match the life cycle of energy assets.