
Currently, there is a significant increase in the computing power of computers due to the development of revolutionary neural networks and quantum computers. These technological advances open new horizons in various fields that require high computing power, such as artificial intelligence, big data analysis, cryptography, and others. Neural networks are algorithms and machine learning models that imitate the functions of the human brain. With the help of deep learning, which is one of the approaches to creating neural networks, computer systems are able to recognise images, process natural language, make decisions and perform other complex tasks. Revolutionary neural networks are opening up new possibilities for building autonomous systems, robots, medical diagnostic tools, and more.
Quantum computers are a new generation of computers based on the principles of quantum mechanics. Classical computers use bits that can take the values 0 and 1, while quantum computers use qubits that can be in states 0, 1 or a linear combination (superposition). This allows quantum computers to efficiently perform certain computations, such as factorisation of large numbers and solving optimisation problems that are inaccessible to classical computers. The development of revolutionary neural networks and quantum computers opens up new opportunities for science, technology and industry. They make it possible to solve complex problems more efficiently and quickly, process large amounts of data and create new innovative products and services. Together they represent a powerful toolkit for overcoming the limitations of classical computing methods.
Thus, the range of tasks with large amounts of data that are relevant to consider is expanding. The problem of finding relevant data, the study of which will bring additional knowledge and information, and the need to work with a large amount of information appears. This leads to new challenges and problems that require the use of different methods and tools to effectively analyse and process data. This situation requires researchers and analysts to expand their set of skills and competences to be able to work effectively with large amounts of information and extract valuable insights and conclusions from it.
This paper proposes implementing the generation of real geographical data using advanced software and hardware packages. The generated data will be scrutinised to study the terrain, predict the impact of various factors on the environment, and formulate countermeasures.
Methods
To choose the method for analysing and generating data, it is necessary to review existing methods.
The first topic to consider is the use of neural networks. There are various approaches to this task, including:
- Generative Adversarial Networks (GANs) are deep learning algorithms used to generate new data, such as images, music, and text. GANs have become increasingly popular in recent years due to their ability to generate realistic data. GANs consist of two main components: a generator and a discriminator. The generator is a network that takes random variables (noise) as input and generates new data. For example, if we use GANs to generate images, the generator can take a noise vector and create an image vector. A discriminator is a type of network that takes data, such as images, as input and determines whether it is real or generated by the generator. Its purpose is to classify the data and distinguish between original and generated data. During GAN training, the generator and the discriminator engage in a mini-game. The generator's objective is to create data that is indistinguishable from real data, in order to deceive the discriminator. The discriminator, on the other hand, is trained to become increasingly accurate in identifying the generated data. This process is adversarial, and learning continues until the generator is capable of producing data that is indistinguishable from real data by the discriminator.
- Autoencoders: Autoencoders are neural networks that attempt to reconstruct input data into their output. During the training process, autoencoders create a latent representation of the input data, which can then be used to generate new values. By defining a wider range of possible values during the training phase, an autoencoder can generate values that are consistent with, but different from, the available data.
- Recurrent Neural Networks (RNNs) are capable of incorporating contextual information, making them useful for generating values from real data. For instance, LSTM (long short-term memory) can memorise a sequence of values and predict the next value based on that sequence. This allows for the generation of new values based on these predictions.
Generating values from existing data can be challenging, particularly when there is a lack of data or intricate dependencies.
Therefore, neural networks are not appropriate for solving this problem due to the need for resources and time to train the network on individual datasets at each point.
Therefore, neural networks are not appropriate for solving this problem due to the need for resources and time to train the network on individual datasets at each point. Therefore, neural networks are not appropriate for solving this problem due to the need for resources and time to train the network on individual datasets at each point. Additionally, experience from previous generations will not be useful in the future.
Furthermore, a significant training dataset is required, which can often be prohibitively expensive to collect.
Result
A method previously used in radio electronics, which generates subsequent values through a colouring filter, has been proposed for use. It is important to note that this improved text adheres to the characteristics of objectivity, comprehensibility and logical structure, conventional structure, clear and objective language, format, formal register, structure, balance, precise word choice, and grammatical correctness. This method has relatively simple calculations for each specific point, allowing for a significant amount of data to be obtained in a given geographical point without incurring serious costs.
The calculations can be divided into two stages.
The initial step involves loading the data and computing the autocorrelation function (ACF). ACF measures the correlation between a function and its shifted copy of the function argument at different shift values. It is a useful tool for examining the statistical dependence between consecutive values of a time series or signal. By using ACF, one can determine the degree of correlation between the signal values at various points in the series.
The autocorrelation function (ACF) measures the correlation between a signal and a time-shifted version of itself. It is a measure of similarity between the signal and a delayed version of itself. The shift can be positive or negative, depending on the direction of the shift. The correlation coefficient indicates the degree of similarity or difference between these signals.
The autocorrelation function (ACF) is a valuable tool for various data analysis tasks. It can help identify periodicity or cyclicality in the data by detecting high correlation at certain shifts, indicating recurring patterns. Additionally, the ACF is used in time series forecasting models to assess the impact of past values on predicting future values.
Another application of the ACF is to determine the stationarity of a time series. If the autocorrelation function (ACF) displays a consistent decrease in values as the shift increases, it may indicate the presence of trend or seasonality in the data, suggesting that the series is non-stationary.
The ACF is a valuable tool for analysing and interpreting time series and signals. It aids in identifying dependencies and structure in the data, which can be useful for forecasting and decision-making based on data analysis.
The autocorrelation function is calculated using the formula: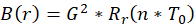 . The trial calculations yielded the autocorrelation function shown in picture 1.
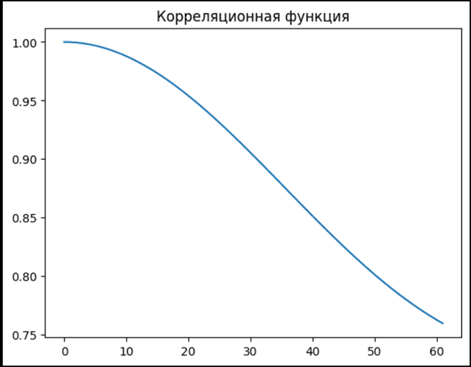
Pic. 1. Calculated autocorrelation function
Then we proceed to the stage of data generation. Firstly, we generate an array of white noise of the required volume (the volume is set before starting the generation). White noise is a random signal with uniform energy distribution over the entire frequency spectrum. It is named "white" by analogy with visible light, in which there is a uniform distribution of all colours. The generated white noise is shown in picture 2.
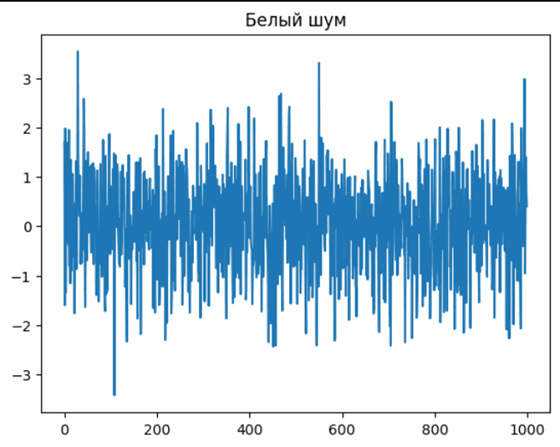
Pic. 2. White Noise
White noise is generated by adding random values to the signal. These values are usually generated using pseudo-random numbers. The result of such generation is a signal in which there is no correlation between neighbouring values and a uniform energy distribution over the entire frequency spectrum is guaranteed.
The above properties are used in the generation, as such a signal can be given the characteristics of the desired signal.
Further, the generation of each new value is performed according to the formula: 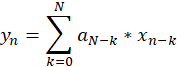 . Thus, when generating the value with index n, the sum of n products will be found, but not more than N (the number of values of the autocorrelation function). The trial generation is shown in picture 3.
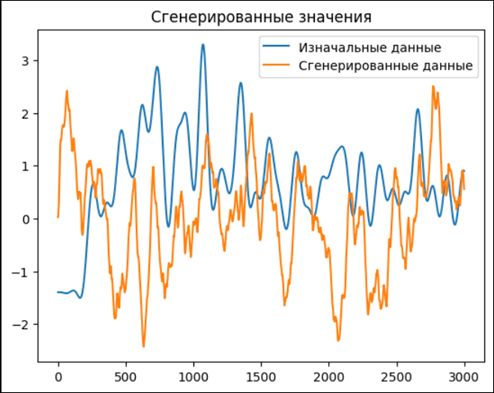
Pic. 3. Generation result
Conclusion
At the moment the task of studying natural physical processes becomes urgent due to the significant development of computing power, but there are no solutions that allow obtaining a large amount of data for further study. The proposed solution will allow even from hard-to-reach geographical locations to obtain sufficient volumes of valid data to implement them in systems for further study. The solution involves collecting a certain number of data, calculating the coefficients of the autocorrelation function and then generating data up to the required volume in a cost-effective manner.
