
Introduction
While the increased efficiency of online services is undeniable, the true potential of e-government goes beyond simple digitalization. The challenges that arise in the context of e-government are how to effectively use huge amounts of data to optimize governance processes. As an example of such a problem, we can consider the problem of forecasting, for example, the growth of citizen demand for a particular service. In this context, neural networks are a very flexible and versatile tool that allows us to analyze and predict various aspects of social life at a deeper level. In particular, this article explores the application of neural network technologies to solve forecasting problems in e-government.
Using a specific example of the growth of car registrations, we will demonstrate how neural networks can be effectively used to produce accurate forecasts. Taking into account the essential parameters, we will propose a step-by-step approach to use neural networks to develop an optimal solution.
Problem statement
In the context of e-government, forecasting demand for various services becomes one of the key tasks aimed at optimizing government resources and improving the quality of service to citizens. In this article, we will focus on forecasting the number of registered vehicles in selected regions for 2024, using data from 1990 to 2022.
While many classical forecasting problems depend only on a point in time (time series forecasting problems), in our case we are dealing with a broader problem where the target values are determined by two parameters: year (point in time) and region. In other words, the input data is a table of size N*2, where a row consists of a specific time and region, and each such row corresponds to a target value from the data set. This forecasting task has practical implications for government agencies as accurate forecasts of the number of registered vehicles can help in road planning, public transport management and pollution control. The presented approach will allow us to take into account not only the time dynamics, but also the geographical characteristics of the vehicle fleet, which makes it more adaptive and relevant for an alternative option for managing economic development.
The main part
The data set for this task was obtained from a government statistical agency, then converted to the following form:
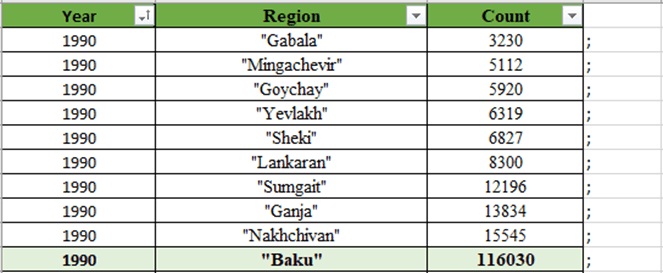
Pic. 1
The data is presented in such a way as to ensure ease of further use. As shown in the table, the data covers ten regions., including Baku, Gabala, Ganja, Goychay, Lankaran, Mingachevir, Nakhchivan, Sumgait, Yevlakh and Sheki. The data covers the period from 1990 to 2022. Thus, the two parameters (year, region) play a key role in the analysis.
Next, we move on to building a neural network using MATLAB and its Neural Network Toolbox. In the following script (pic. 4), the data is converted to the desired types (from string to double precision floating point number) and the categorical data is indexed, since the neural network only accepts double data.
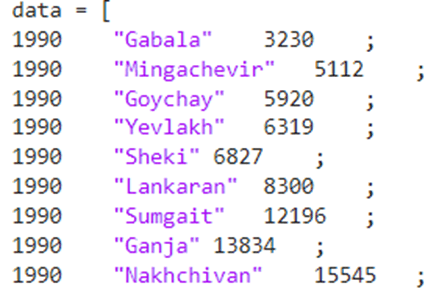
Pic. 2. Combined input and output raw data

Pic. 3. For convenience, test input is in the end of the same table

Pic. 4. Data transformation and processing
At the pictures some data are not presented here due to their lack of compactness. Then a neural network is created and configured. We select 30 neurons in the hidden layer and train the neural network.

Pic. 5. Neural network training results
As can be seen from the table, the trained network gives a correlation coefficient of about 1, which means that the output data of the neural network differs relatively little from the expected ones.

Pic. 6. Regression plot
A low order of error is also shown by a regression plot (pic. 6): all points almost lie on the same straight line, which means that the output values of the neural network coincided or almost coincided with the expected output values.
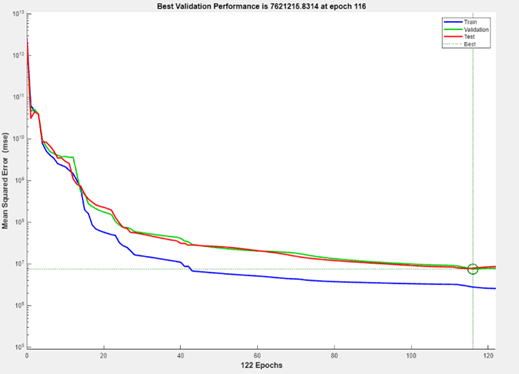
Pic. 7. Performance plot
Now we can apply the trained network to make predictions:

Pic. 8
Then we combine the received data with the input data and after rounding we get:
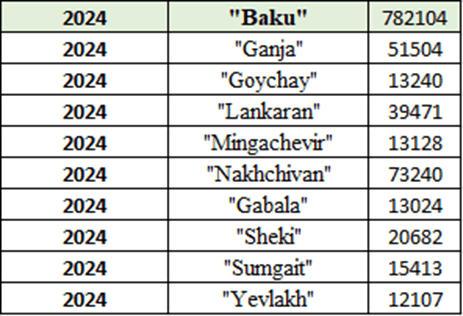
Pic. 9. Forecast results
Conclusion
This article discusses the use of neural networks in the context of e-government using the example of a forecasting problem. The key stages of solving such problems are described in detail, starting from providing the necessary amount of data for training a neural network and ending with setting up and training the network itself.
The purpose of this work is to demonstrate the practical applicability of neural networks in e-government and their potential for improving decision-making processes and increasing the efficiency of public services. The data used in the study was taken from the government statistical agency, providing a basis for analysis and forecasting of important parameters.
