
1. Introduction
This is due to the fact that interpersonal communication will persist. The quality of services (QoS) will be required. An unambiguous measure of the level of service quality provided by telecom providers is the RSSI rating [1]. The RSSI value at the mobile receiver is expressed in dBm units and has a negative sign in front of it. The greater the value, within a particular range, the better. This value thus corresponds directly to the signal strength received by the device from the tower. The cellular carriers do not impose any tight range on the RSSI value; nonetheless, a value of -70 dBm or above places the device in an excellent coverage region with maximum signal strength. Table 2 presents the consolidated ranges for the 4G system, whereas Table 1 highlights the ranges of the RSSI examined for 2G and 3G.
Table 1
RSSI Value for 2G and 3G with their description
| RSSI | Signal strength | Description |
| <= -70 | Excellent | Strong signal with maximum data speeds |
| -70 dbm to -85 dbm | Good | Strong signal with good data speed |
| -86 dbm to -100 dbm | Fair | Fair but useful, fast and reliable data speeds may be attained, but marginal data with drop-outs is possible |
| > -100 dbm | Poor | Performance will drop drastically |
| -110 dbm | No signal | Disconnection |
Table 2
RSSI Value for 4G with their description
| RSSI | Signal strength | Description |
| <= -65 | Excellent | Strong signal with maximum data speeds |
| -65 dbm to -75 dbm | Good | Strong signal with good data speeds |
| -75 dbm to -85 dbm | Fair | Fair but useful, fast and reliable data speeds may be attained, but marginal data with drop-outs is possible |
| -85 dbm to -95 dbm | Poor | Performance will drop drastically |
| > -100 dbm | No signal | Disconnection |
2. The Global System for Mobile Communication (GSM)
Wireless communication is a way of transmitting information from one point to other points without making use of some kind of connection, such as wires, cables, or other physical mediums. Generally, a communication system in its most general form implies information going from a transmitter to a receiver which is then put over some limited distance [3]. The universal mobile communication modem known as GSM stands for Global System for Mobile Communication. This mobile communication technology was created in 1970 by Bell Laboratories and is currently one of the most used worldwide. . It is an open digital cellular technology transmitting mobile voice and data service that functions in a frequency band of 850MHz, 900MHz, 1800MHz, and 1900MHz. 3. The mobile station consists of a user's smartphone that is shown and has a processor limited by a SIM card. Base Station Subsystem: This component is thought to act as the organizational subsystem's interface with the mobile station. It has a Base Transceiver Station with radio components that manage users' mobile data. The Base Transceiver Station (BTS) is managed by the Base Station Controller (BSC), which also serves as a mobile station in relation to the MSC organization interface. This takes the center place as a role of the network subsystem that avails the required portable stations' organization. This Mobile Service Switching Center provides access to numerous organizations such as ISDN, PSTN, and others. It also has two features, a Home Location Register and a Visitor Location Register, which allow GSM call routing and roaming capabilities. The Equipment Identity Register, which maintains a record of all mobile devices and assigns each one a unique IMEI number, is also included.. IMEI Stands for International Mobile Equipment Identity [3].
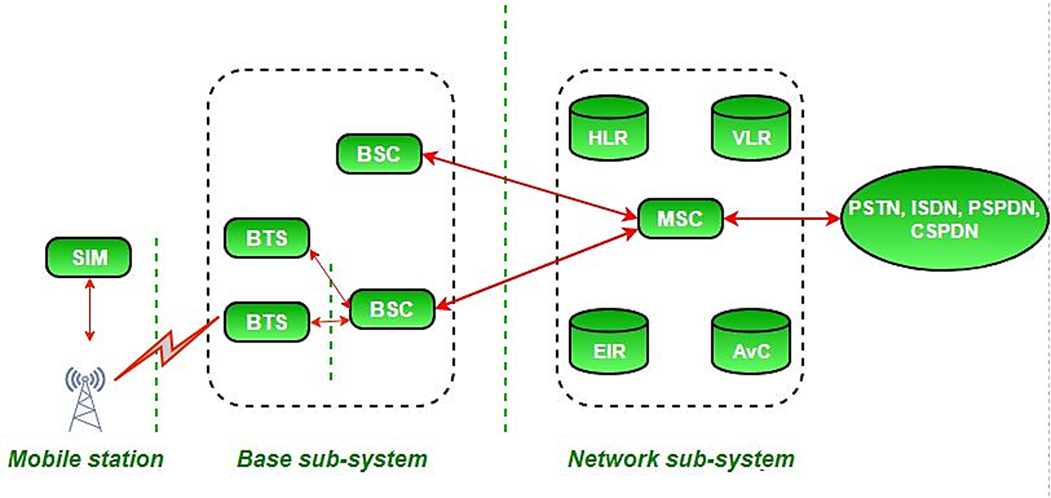
Fig. 1. GSM architecture
3. Handoff in Mobile Communications
This is because the handover procedure occurs between two communication towers on each mobile pass, or it may occur within a single tower between two antennas. This is referred to as a handoff or handover [4] and it takes place to guarantee that network users may be in constant communication with one another. There are two other ways that handoffs can happen: Types of Handoffs: Hard/Soft [5, p. 73-77]. Company Transfer This occurs in cellular networks between two antennas and two base stations. The station that was connected to the new terminal caused a brief stop in the process. This may also be called a "break-before-make" handover, a hard handoff, or a handover. This usually works rather well because, in this instance, handoff disconnection is not to occur during handoff. The hard handoff is also cheaper than the soft handover since it can involve one transmitting channel. In Figure 2, the hard handoff is depicted. The process a cell phone user goes through when switching between two stations is called a "soft handoff." To complete this process, the previous station has been disconnected and then linked to. Should two separate cells seamlessly merge together. A mobile phone typically has one RF receiver. As a result, the two cells ought to be transmitting on the same GSM frequency. "Softer Handoff" refers to a soft handoff that already occurs between two antennas in the same station. The simultaneous use of two channels during a soft handoff can be expensive. Figure 3 depicts this procedure.
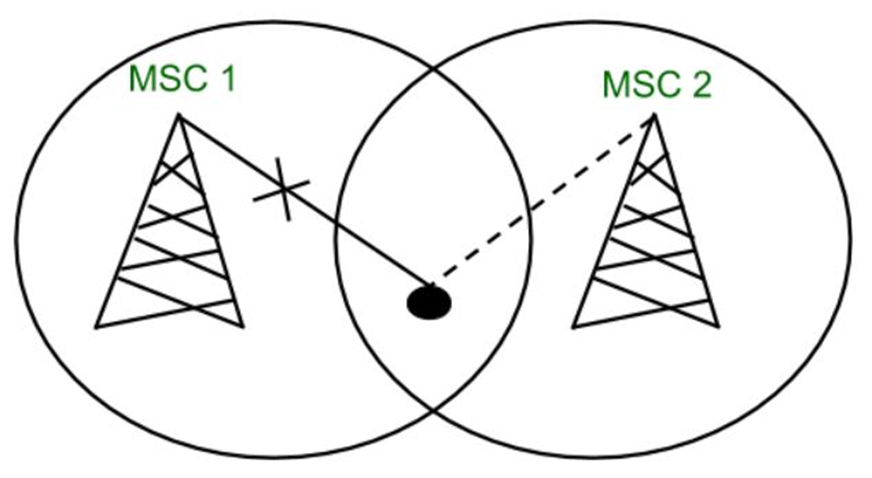
Fig. 2. Hard handoff operation
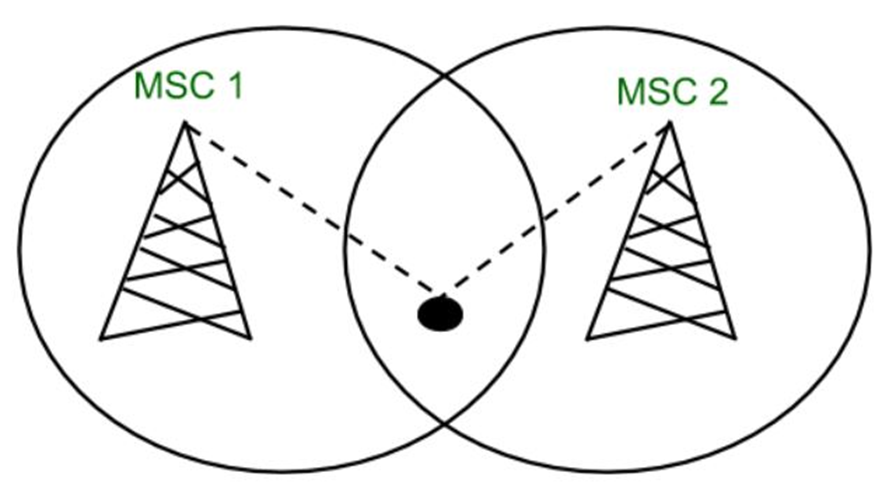
Fig. 3. Soft handoff operation
An acceptable range for RSSI indicates that the handoff process was successful; if not, the signal was discarded. The handoff method and RSSI are closely related.
4. Path Loss
The term "path loss" describes how a signal's transmitted strength decreases as it travels across the medium. Path loss is the primary factor considered when designing a communication link's radio link budget [6, p. 78-86]. Numerous factors, including refraction, reflection, and wave absorption, can cause path loss. As seen in Fig. 4, the route loss is investigated using the topography contours, settings like urban or rural, propagation media like dry or air, the separation between the transmitter and receiver, antenna heights, and location. The RSSI and path loss are inversely correlated; that is, a high path loss corresponds to a weak received power [6, p, 78-86; 7, p. 231-242].
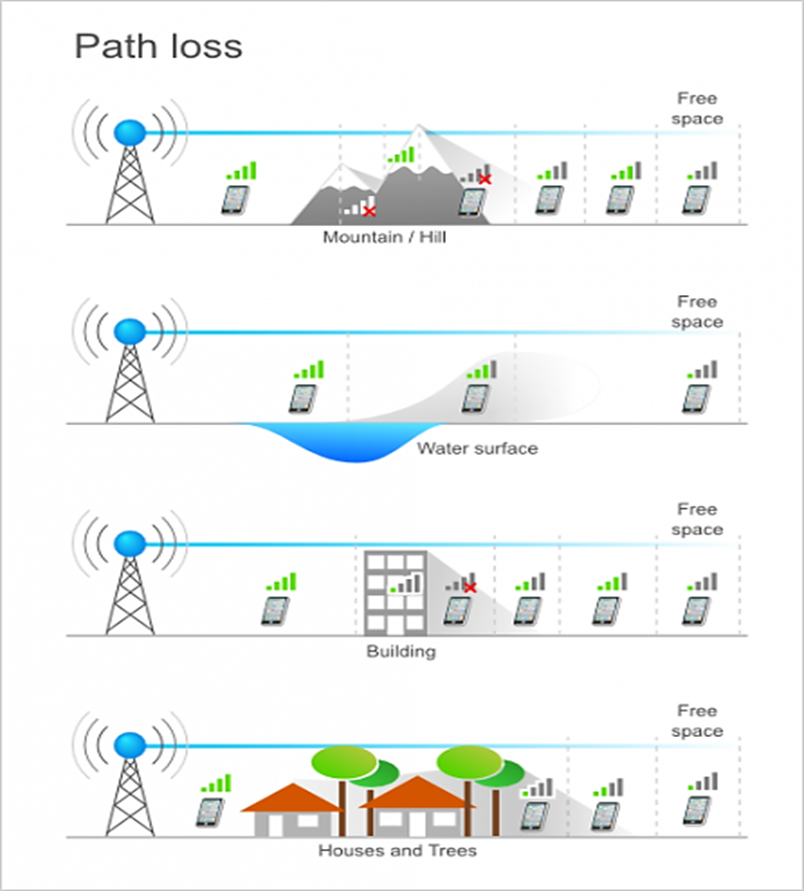
Fig. 4. RSSI as a function of Path loss effects
5. Broadcasting Range and Coverage Area
"Range" refers to the greatest separation that two radios can have while maintaining communication. The signal's coverage area can be determined using the area of a circle formula, πr^2, where r is the coverage region's radius. A telecommunications system's "cell" is the term for this coverage region, and the terms are commonly used interchangeably. A compromise between average data rate and receiver can be made to retain a higher data rate in terms of range at a shorter receiver-to-transmitter distance. In an open setting, also referred to as "free space," power changes inversely with distance cube. Only in response to a growth in gain would power rise. A wireless signal's potential range may be extended by it. Certainly, path loss as a percentage will result in a decrease in the signal's range between a transmitter and a receiver; route loss can undoubtedly impact this as well.
6. Signal to Noise Ratio (SNR)
The ratio of a signal's strength to that of background noise is known as the signal-to-noise ratio.
SNR=Psignal / Pnoise
P is the average power when the system bandwidth is the same. It is intended that the signal power and the noise power be measured at the same or comparable sites within the system. In this case, since the SNR of the system is higher, it means that the RSSI at the receiver is higher [10, p. 105-119]. SNR consists of two values. It is interpreted as a positive number in the range of 0 dB and 120 dB. Values that approach (120db) are better. Generally, both signal and noise values are expressed in decibels based on most situations. The RSSI (Received-Signal-Strength-Indication) values are expressed in decibel signal from (0 to -120). The closer to 0 dB the measured value is, the stronger the signal, meaning better. Generally, the voice signal needs the signal level of -65 dB or higher, while the data signals need -80 dB or more. This will include such things as transmitter power and receiver antenna position that affect the signals within the normal ranges of a network, which have required limits based on the power levels and design (-45 dB to -87 dB). Signal strength (also known as the Signal/Noise Ratio, or RSSI). In general, it is advisable to concentrate on RSSI.
- RSSI > -90 dBm: This signal is extremely weak, at the edge of what a receive.
- RSSI -67 dBm: This is a fairly strong signal.
- RSSI < -55 dBm: This is a very strong signal.
- RSSI < -30 dBm: Your sniffer is sitting right next to the transmitter.
Fig. 5 shows the relation between the RSSI and SNR values.
Fig. 5. RSSI and SNR as a function of transmit power
7. The Concepts of Voltage Standing Waves Ratio (VSWR)
(VSWR) is the ratio between transmitted voltage and reflected standing waves voltage in radio frequency electrical signals. It gives an indication about the efficiency of transmitted RF power from the source to the transmission line, then to the receiver. A clear example of VSWR is the power amplifier that connected to the antenna by utilizing the transmission line.
A high VSWR is unwanted because it indicates weak transmission line efficiency and reflected energy, high VSWR can damage the transmitter also decrease transmitter efficiency [11, p. 610-611]. In the event when (Γ) is the reflection coefficient, the following formula defines the VSWR:
VSWR is computed by the voltage taken down any transmission line feeding into an antenna [11, p. 610-611; 12, p. 145-148]. This is a representation of the standing wave's ratio between the maximum amplitude and the minimum amplitude between nodes and anti-nodes shown in the figure below.
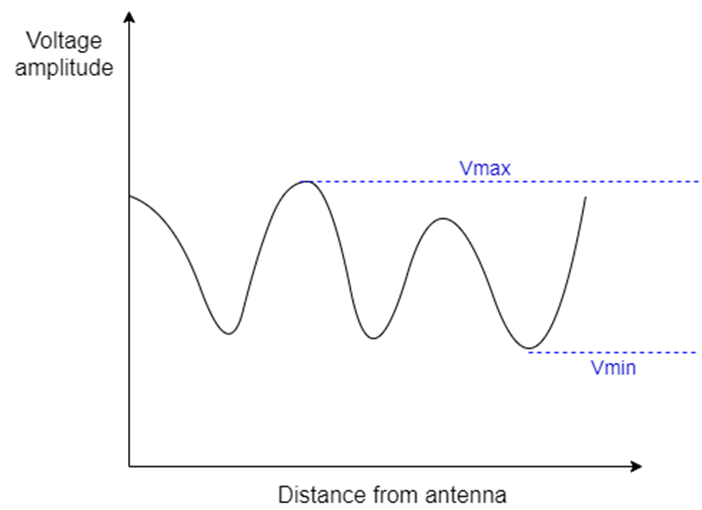
Fig. 6. The measured voltage along the transmission line
According to the information from the receiver, shown in Table 1, the antenna is supplied with 36% of reflected power and 64% of delivered power. All the power reflects at a value of 0 dB, thus from the VSWR of 0 dB. From -10 dB, only 10% of power reflects. If everything reflects on the source, then that means that the VSWR must be infinity.
Table 3
VSWR, reflection coefficient of sector no.11 ( , Reflected Power percent and reflected power in (dB) measured by site master device
| VSWR | (Γ), (S11) | Reflected power (%) | Reflected power (dB) |
| 1.0 | 0.000 | 0.00 | - Infinity |
| 1.5 | 0.200 | 4.0 | -14.0 |
| 2 | 0.333 | 11.1 | -9.55 |
| 2.5 | 0.429 | 18.4 | -7.36 |
| 3.0 | 0.500 | 25.0 | -6.00 |
| 3.5 | 0.556 | 30.9 | -5.10 |
| 4.0 | 0.600 | 36.0 | -4.44 |
| 5.0 | 0.667 | 44.0 | -3.52 |
| 6.0 | 0.714 | 51.0 | -2.92 |
| 7.0 | 0.750 | 56.3 | -2.50 |
| 8.0 | 0.778 | 60.5 | -2.18 |
| 9.0 | 0.800 | 64.0 | -1.94 |
| 10.0 | 0.818 | 66.9 | -1.74 |
| 15.0 | 0.875 | 76.6 | -1.16 |
| 20.0 | 0.905 | 81.9 | -0.87 |
| 50.0 | 0.961 | 92.3 | -0.35 |
In short, VSWR is one of those parameters which are important at sites of wireless transmitters for a number of reasons. Some of them can be:
- VSWR is a very good measure of healthiness of the antenna system.
- Corruption in performance of network. This might be coverage, voice quality, data throughput etc.
- Preventing impairment and failure to transmitters and repeaters caused due to high VSWR.
- Shows if the network is performing as designed and intended.
8. Antenna and Feeder Checking
In case of any emergency or malfunction that can affect one of the RSSI's antennas, the antenna and cables need to be inspected to make sure they are secure. keeping an eye out for any external damage or deterioration over time due to the RRU unit's slot and the feeder cable's close proximity. Device inspection of the cable is shown in (fig. 6). The device was installed on a specially designed apparatus called Site Master. I.e. It sends and receives a signal inside the cable, and then calculates the ratio between the transmitter and receiver. That the control is shown to be defective is crucial. Subsequently, the technician ascends to the affected location to examine any particular damage or leaks between the cable and the cable jumper or feeder. This identical device has an option that finishes the process by figuring out the defective distance.
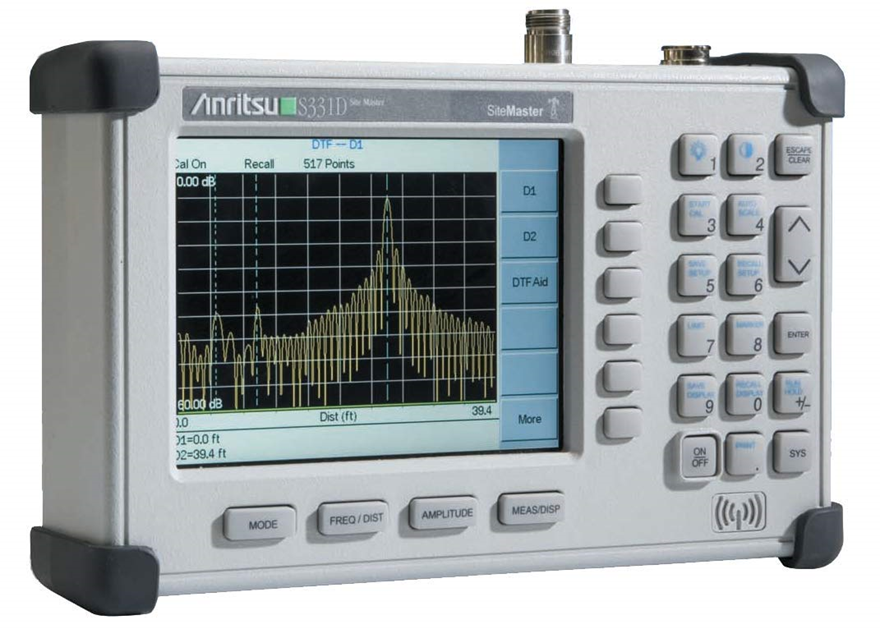
Fig. 7. Site Master Device
- The difference in RSSI between the main and divider cables illustrates the measurements for the three distinct sectors:
- Direct signal transfer from the user to the antenna is made possible by the Main cable, which is responsible for transmitting the signal from the antenna to the processing units.
- The division cable, which extends from the antenna to the processing unit, is responsible for transporting signals that were not directly received by the antenna due to impediments, dispersion, reflection, and other signal disturbances encountered en route from the user to the antenna.
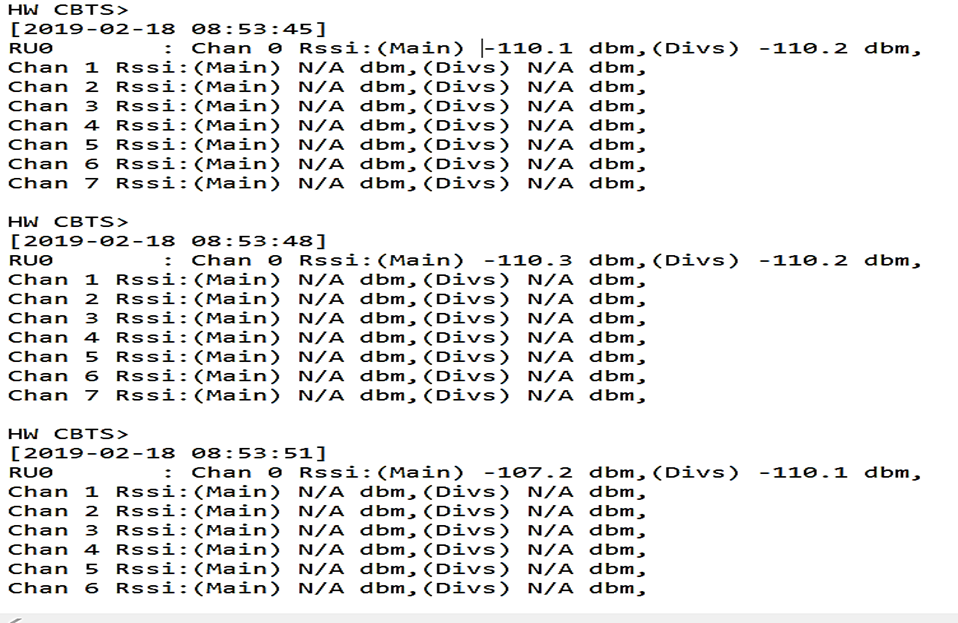
Fig. 8. The difference between Main and Divs in sector 0
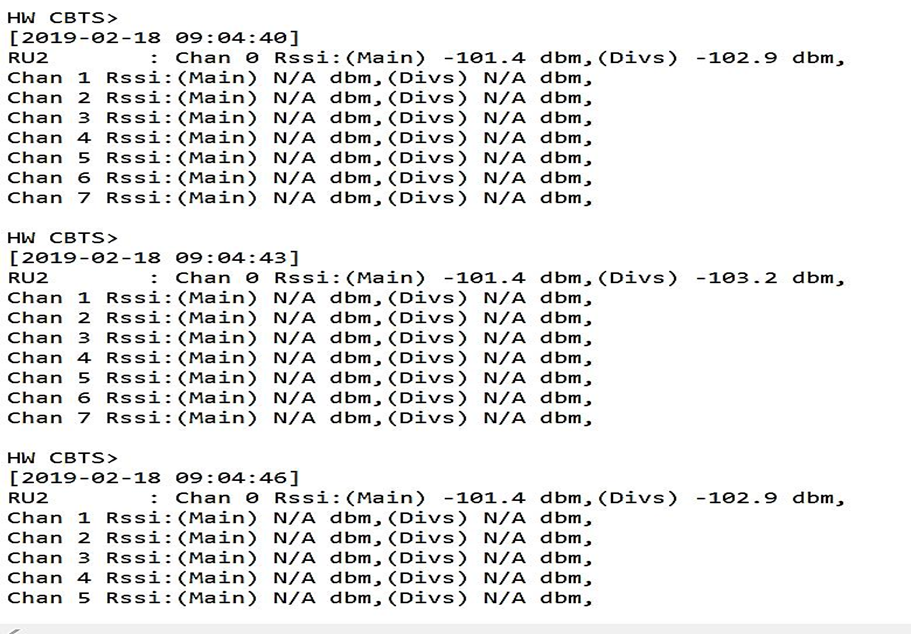
Fig. 9. The distinction in sector 1 between Main and Divs
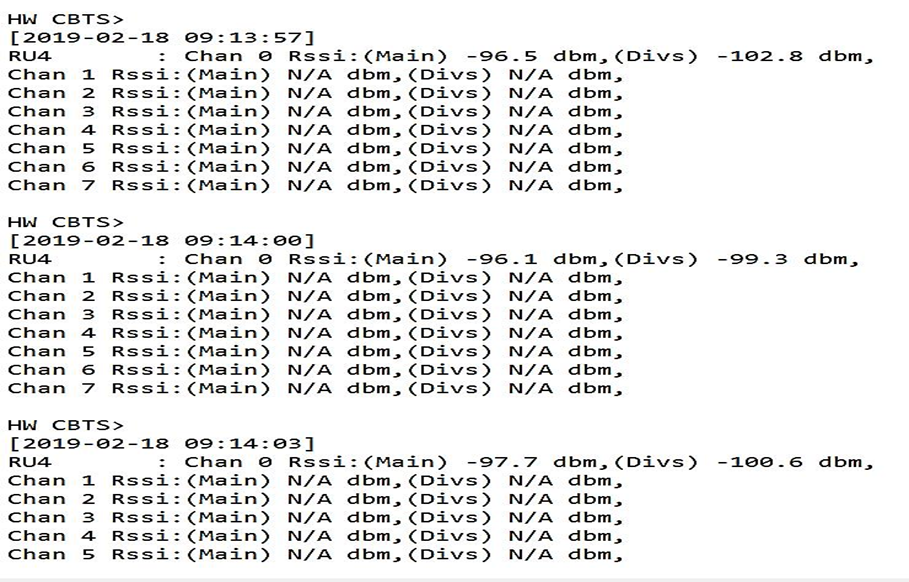
Fig. 10. The difference between Main and Divs in sector 2
9. Indoor and Outdoor RSSI
Practically there are two cables in each sector (main) and (diversity), the outdoor signals that reached from the mobile to the sector directly without reflecting from the obstacles is directly connected to the main cable, while the indoor signals that is reflecting from the walls and obstacles is connected to the diversity cable [13, p. 1-3].
10. Radio Link Budget
A communication system's link budget is an overview of all profits and losses. The intensity of the signal at the receiver input is determined by adding the values of transmitted power, gains, and losses in the link budget. The losses are varying with time as the fading, and thus adaptation must be made within the link budget in such cases by considering the worst case, in addition an acceptance of period of the increased bit error rate (for the digital signals) or degraded performance of the signal to noise ratio for the analog Systems. Generally, the radio link budget takes a form of the Eq. 1 As shown below:
Received power (dBm) =Transmitted power (dBm) +Gains (dB) – Losses (dBm) (1)
To devise the radio link budget recipe, it is important to investigate the stages where the gains and losses may occur in the path between the transmitter and receiver. In spite of the fact that rules and proposals can be made with respect to the potential zones for misfortunes and additions, each connection must be examined on its own benefits. Fig. 11 shows the radio communication transmission topology and Fig. 12 shows the basic link budget calculation. An ordinary connection spending condition for a radio interchanges framework is appeared in Eq.2:
PRX=PTX+GTX+GRX-LTX-LFS-LP-LRX (2)
Where:
PRX = Received power (dBm)
PTX= Transmitter antenna power (dBm)
GTX= Transmitted antenna gain (dBi)
GRX= Received antenna gain (dBi)
LTX = Transmitted feeder and associated losses (feeder, connectors, etc.) (dB)
LFS= Free space loss or path loss (dB)
LP= Miscellaneous signal propagation losses (these include fading margin, polarization mismatch,
Losses associated with medium through which signal is travelling, other losses ….) (dB)
LRX = Received feeder and associated losses (feeder, connectors, etc.) (dB)
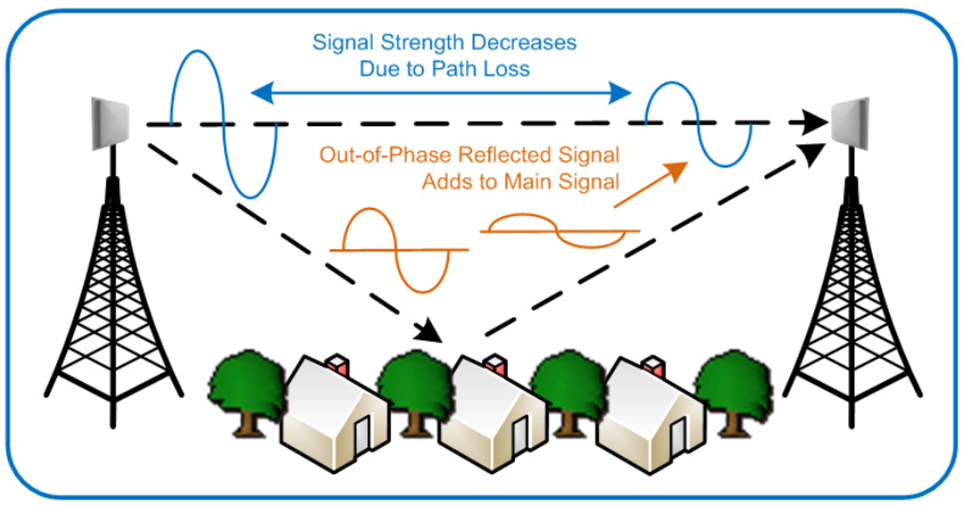
Fig. 11. The radio communications transmission topology
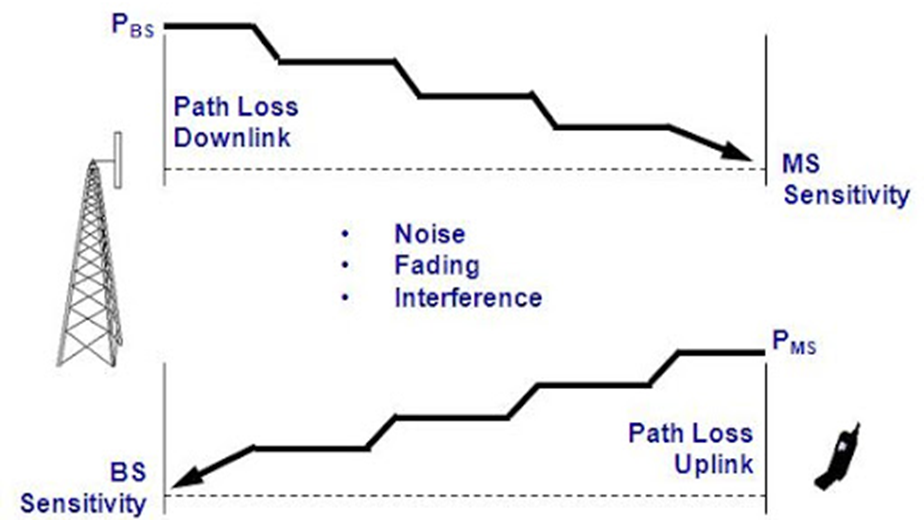
Fig. 12. The basic link budget calculation
11 Conclusion
As its name indicates, the important indicator is to remain in a certain range of values. This range of values changes with the range of signals – it can be indoors or outdoors, and voice, data, or multi-purpose usage. The Received Signal Strength Indicator (RSSI) performance is studied in many ways, considering path loss and environments. If the received signal strength indicator (RSSI) changes for some reason, there will be a corresponding change in the path loss at the receiving side of the receiver. The coverage of a wireless signal and its range determine the long distance (range) between the transmitter and receiver. This opens up space for path loss and growth in attenuation, which gradually reduce the RSSI at the receiver. That is, with this higher SN snr, this channel brings higher RSSI to the receiver. To elude any lack of RSSI, periodic maintenance must be applied not only to the transceiver but in the complete communication system.
