.png&w=384&q=75)
Introduction
While the digital transformation of public services has significantly increased administrative efficiency, the true potential of e-government lies in its evolution from a service provider to an intelligent decision-support system. A primary challenge in modern governance is the effective utilization of high-dimensional data to optimize national economic planning. One critical aspect of this is the ability to accurately forecast macroeconomic indicators, such as retail trade turnover, which serves as a vital barometer for a nation's fiscal health.
This article explores the application of neural networks as a robust tool for non-linear economic modeling within an e-government framework. Specifically, we demonstrate a methodology that leverages regional economic data to generate precise national-level forecasts for future years. By utilizing a multi-parameter approach – incorporating both temporal and geographical variables – we illustrate how neural networks can transform raw statistical data into actionable intelligence for national policy and budgetary allocation.
Problem Statement
In case of modern E-government monitoring and anticipating economic trends is one of the fundamental necessities for ensuring national stability. Retail trade turnover is one of the most necessary macroeconomic indicator which reflects straightly citizen’s spending power and serves as main source for VAT (Value Added Tax) and sales tax revenue. Therefore precise turnover forecasting is necessary condition for effective national budgetary planning.
Traditional forecasting methods often rely on aggregate, 'top-down' time-series analysis, which treats the national economy as a monolithic entity. However, economic activity is geographically non-uniform; different regions experience growth or stagnation at different rates. Relying solely on historical national averages can lead to fiscal inaccuracies, as it fails to account for the non-linear relationship between regional performance and national outcomes. Furthermore, many E-government systems remain 'reactive' – reporting data after the fact – rather than 'predictive.
In this article the final point will be creating high-accuracy forecasting for future years by using Neural Network (NN). Unlike linear models, the proposed three-layer (hidden layers) simple Neural Network architecture with 60 neurons(node) on each layer is designed to process a multi-dimensional dataset consisting of temporal (Year) and geographical (Region) variables. By training the network on data spanning from 1991 to 2024, we aim to produce an optimized forecast for national retail trade turnover for future years.
Developing this predictive capability within an Electronic government ecosystem allows governmental agencies to transition toward evidence-based governance. An accurate 2024 forecast provides the Ministry of Finance, the Ministry of Trade, and regional planners with a reliable base and foundation for allocating and distribution resources, setting and planning tax targets, and identifying potential economic risks before they manifest at the national level.
The Main Part
There we have initial data for retail turnover for 1991 by region and by country. This data was taken from national statistical agency and converted in following form:

Fig. 1. Earliest Values
The data is here is presented in a way which makes it easier for further use as shown in the table the data covers 14 features country, capital, and 12 other administrative units. The Monthly Data and Regions will play a key role in data analysis.
Next we will split data to training, validation and test data.
Training data is needed for initial training for making neural network find patterns between data features, adjust internal parameters and overall it is needed to make neural network understand the relationship between input and output parameters. The goal of training data is to minimize error on known example. The analogy is a student who solve practice problems in textbook that have answers in the back. The training data is 70% of our overall dataset in this case
Validation Data is needed to check whether model is actually training or memorizing data (problem of memorizing data in neural network called overfitting). The validation set is used to adjust hyperparameters the settings you choose before training begins, like how fast the model learns. Goal of validation set is to pick the best version of the model and prevent it from becoming too specialized to the training data. Validation data is like midterm quiz for student so the teacher could evaluate the performance of student and adjust his teaching style before final exam. In case of this article validation dataset is 15% of our overall dataset.
Test data is kept “hidden” from neural. Once developer of model is confident in his model he runs it and after compare with test set and if predicted test results are nearly similar it means model works pretty well. And this means the model can be deployed in real world. It is like final exam for student. The test data is 15% of our overall dataset.
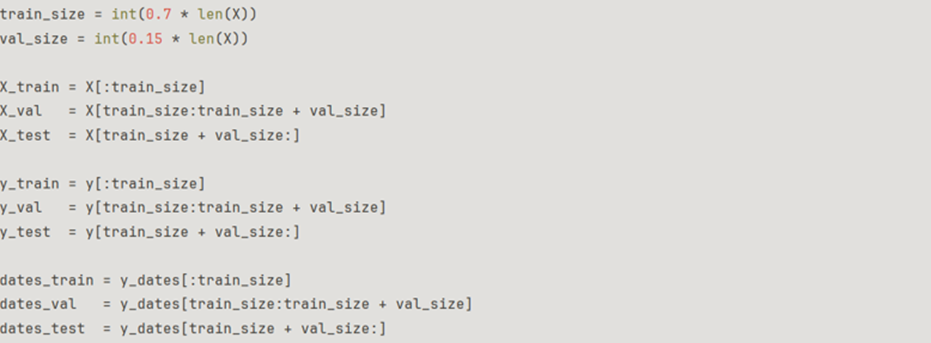
Fig. 2. Splitting data to training,test and validation
All of the data cannot be presented due to the data size and for evaluation of effectiveness of our neural network I will use MAPE (Mean Absolute Percentage Error.) which is defined by this formula.
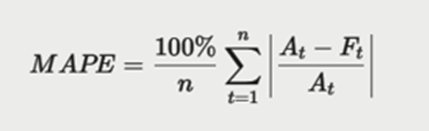
Fig. 3. MAPE Formula
It is better than mean squared error because we can see the error by percent not by absolute values.
But first we should train model. Our training windows size is 12 which means we will use 12 values to predict next value.
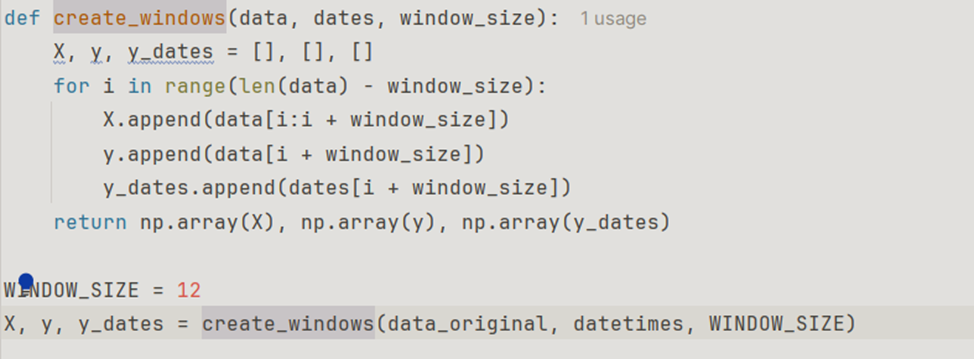
Fig. 4. Creating Windows
Here we can see our validation losses and training losses on each 100 epochs.
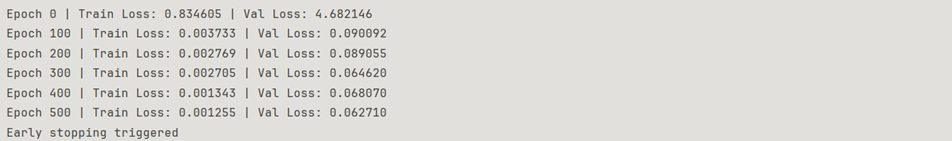
Fig. 5. Training And Validation Losses
If our training loss is low but validation loss is high it means our model over fitting, but if both values are low this means our model is underfitting.
Our MAPE Values in this case. They are all is lower than 10% which means our neural networks performs very well.
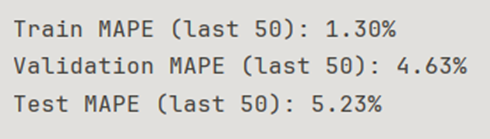
Fig. 6. MAPE Results
And this is our plots for which I used matplotlib library.
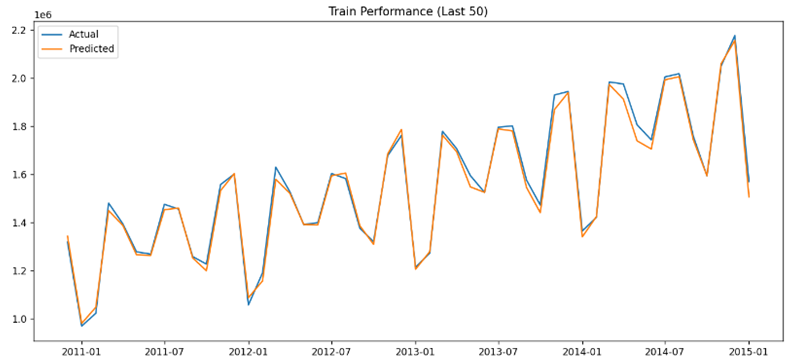
Fig. 7. Training Performance
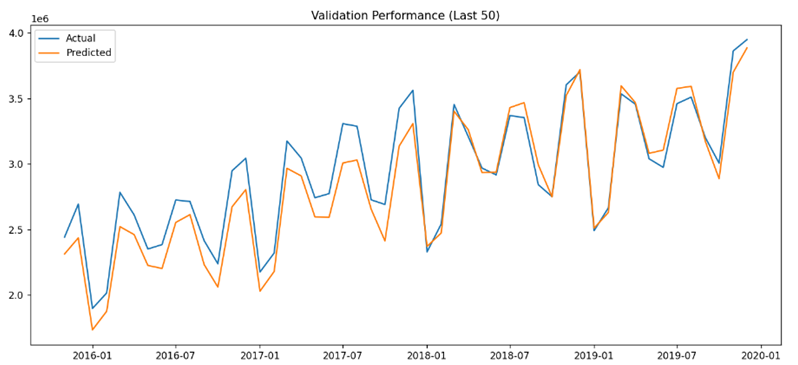
Fig. 8. Validation Performance
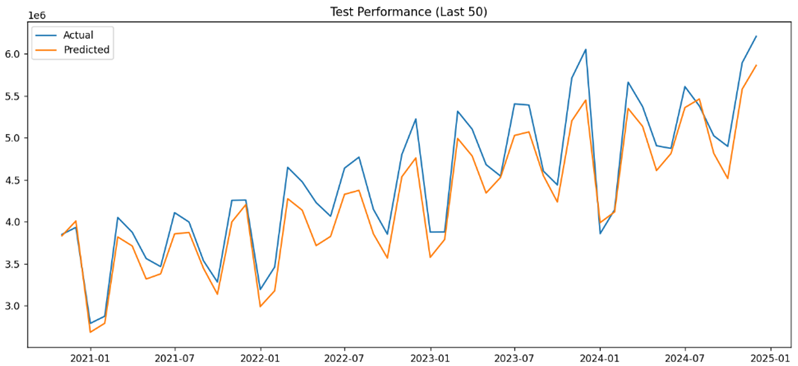
Fig. 9. Test Performance
Fig. 10. Displaying Resuls
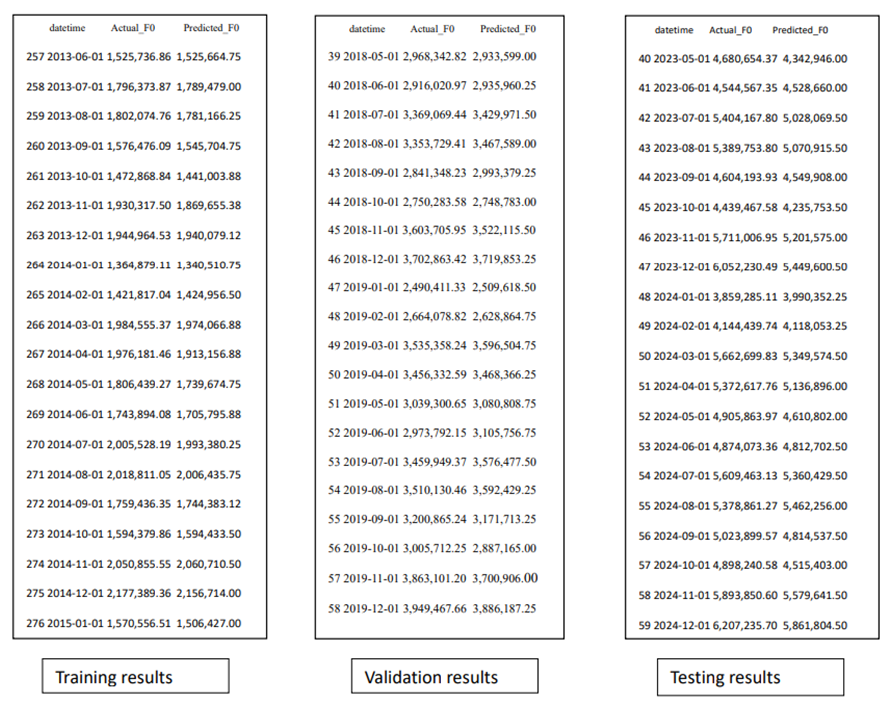
Fig. 11
Now we can look further for future results so for this I will use this code.
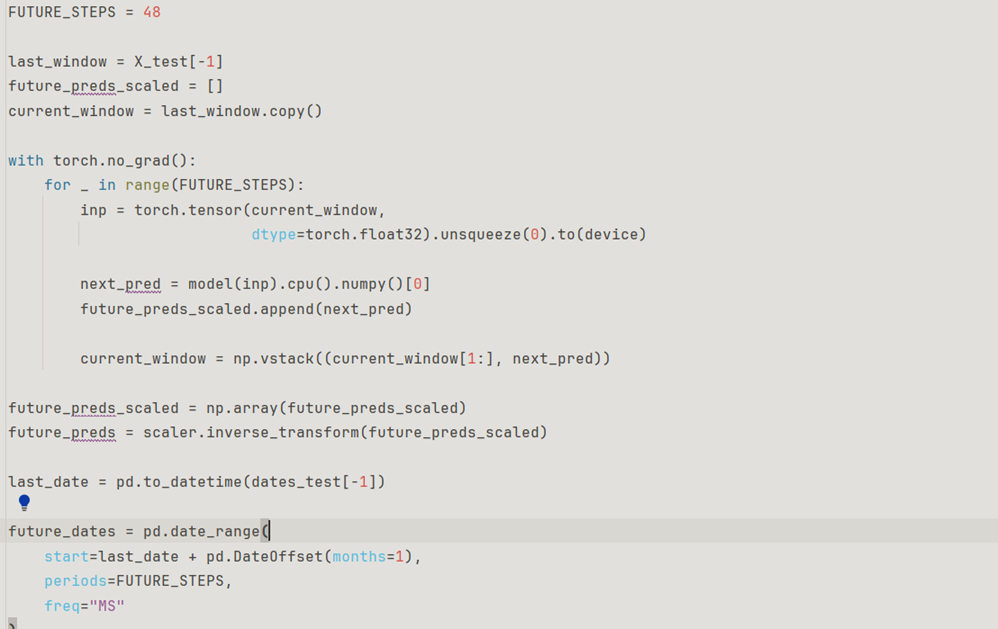
Fig. 12. Future Steps
From plot below we can see overall rising of retail trade turnover by country for 4 years or 48 months.
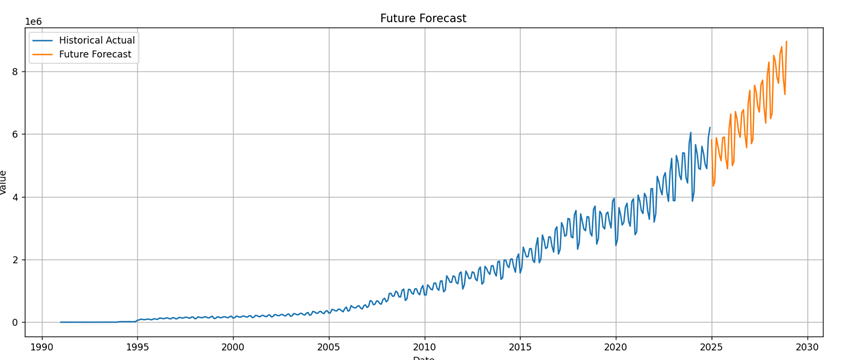
Fig. 13. Future Forecasts
Future Predictions:
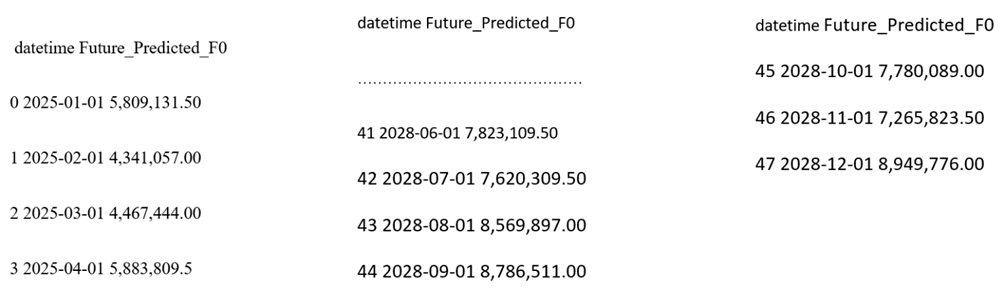
Fig. 14
The future predictions above based on monthly data, this is predictions based on yearly data.
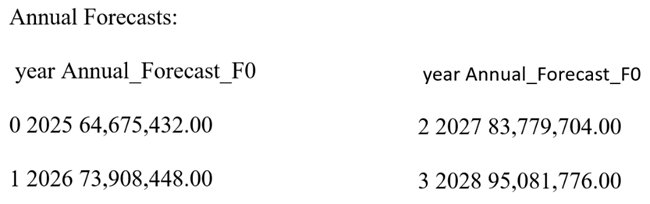
Fig. 15
From this we can see that in 2027 and 2028 the overall retail trade by country.
Conclusion
This article explores how neural networks can modernize e-government, specifically focusing on their application in predictive modeling. It outlines the end-to-end workflow of implementing these systems–from data acquisition and preprocessing to the final configuration and training of the network.
By utilizing official datasets from government statistical agencies, the study illustrates how AI can refine public administration. Ultimately, the work aims to prove that neural networks aren't just theoretical; they are practical tools capable of streamlining public services and fostering data-driven decision-making.
